
 Yahoo Finance
 Those who invested in Goldman Sachs Group (NYSE:GS) five years ago are up 121%
Stock pickers are generally looking for stocks that will outperform the broader market. Buying under-rated businesses is one path to excess returns. For example, the The Goldman Sachs Group, Inc. (NYSE:GS) share price is up 95% in the last 5 years, clearly besting the market return of around 62% (ignoring dividends). On the other hand, the more recent gains haven't been so impressive, with shareholders gaining just 21% , including dividends .
So let's assess the underlying fundamentals over the last 5 years and see if they've moved in lock-step with shareholder returns.
View our latest analysis for Goldman Sachs Group
While the efficient markets hypothesis continues to be taught by some, it has been proven that markets are over-reactive dynamic systems, and investors are not always rational. One way to examine how market sentiment has changed over time is to look at the interaction between a company's share price and its earnings per share (EPS).
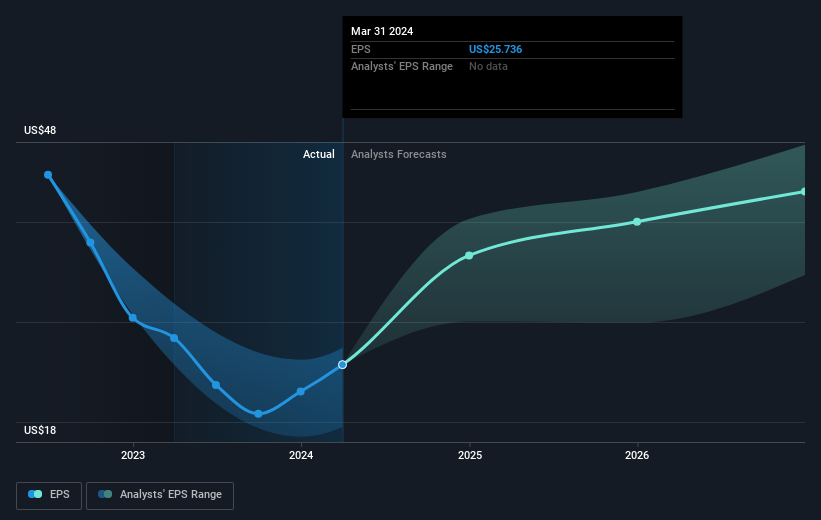
Over half a decade, Goldman Sachs Group managed to grow its earnings per share at 0.9% a year. This EPS growth is slower than the share price growth of 14% per year, over the same period. So it's fair to assume the market has a higher opinion of the business than it did five years ago. That's not necessarily surprising considering the five-year track record of earnings growth.
You can see how EPS has changed over time in the image below (click on the chart to see the exact values).
This free interactive report on Goldman Sachs Group's earnings, revenue and cash flow is a great place to start, if you want to investigate the stock further.
What About Dividends?
It is important to consider the total shareholder return, as well as the share price return, for any given stock. Whereas the share price return only reflects the change in the share price, the TSR includes the value of dividends (assuming they were reinvested) and the benefit of any discounted capital raising or spin-off. So for companies that pay a generous dividend, the TSR is often a lot higher than the share price return. We note that for Goldman Sachs Group the TSR over the last 5 years was 121%, which is better than the share price return mentioned above. This is largely a result of its dividend payments!
A Different Perspective
Goldman Sachs Group's TSR for the year was broadly in line with the market average, at 21%. Most would be happy with a gain, and it helps that the year's return is actually better than the average return over five years, which was 17%. It is possible that management foresight will bring growth well into the future, even if the share price slows down. I find it very interesting to look at share price over the long term as a proxy for business performance. But to truly gain insight, we need to consider other information, too. Consider risks, for instance. Every company has them, and we've spotted 2 warning signs for Goldman Sachs Group you should know about.
If you like to buy stocks alongside management, then you might just love this free list of companies. (Hint: insiders have been buying them).
Please note, the market returns quoted in this article reflect the market weighted average returns of stocks that currently trade on American exchanges.
Have feedback on this article? Concerned about the content? Get in touch with us directly. Alternatively, email editorial-team (at) simplywallst.com.
This article by Simply Wall St is general in nature. We provide commentary based on historical data and analyst forecasts only using an unbiased methodology and our articles are not intended to be financial advice. It does not constitute a recommendation to buy or sell any stock, and does not take account of your objectives, or your financial situation. We aim to bring you long-term focused analysis driven by fundamental data. Note that our analysis may not factor in the latest price-sensitive company announcements or qualitative material. Simply Wall St has no position in any stocks mentioned.
