
 Yahoo Finance
 Those who invested in Full House Resorts (NASDAQ:FLL) five years ago are up 144%
The worst result, after buying shares in a company (assuming no leverage), would be if you lose all the money you put in. But on a lighter note, a good company can see its share price rise well over 100%. Long term Full House Resorts, Inc. (NASDAQ:FLL) shareholders would be well aware of this, since the stock is up 144% in five years. It's down 4.1% in the last seven days.
With that in mind, it's worth seeing if the company's underlying fundamentals have been the driver of long term performance, or if there are some discrepancies.
Check out our latest analysis for Full House Resorts
Full House Resorts isn't currently profitable, so most analysts would look to revenue growth to get an idea of how fast the underlying business is growing. Shareholders of unprofitable companies usually desire strong revenue growth. As you can imagine, fast revenue growth, when maintained, often leads to fast profit growth.
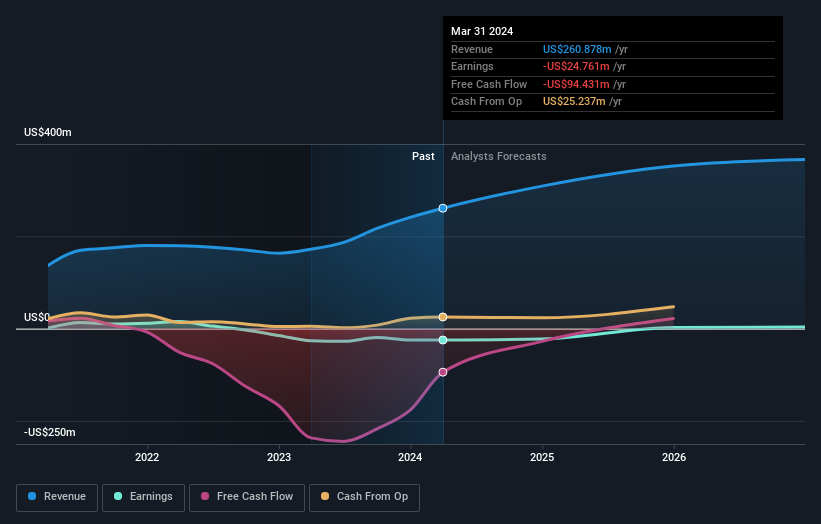
For the last half decade, Full House Resorts can boast revenue growth at a rate of 8.6% per year. That's a fairly respectable growth rate. We'd argue this growth has been reflected in the share price which has climbed at a rate of 19% per year over in that time. Given that the business has made good progress on the top line, it would be worth taking a look at the growth trend. When a growth trend accelerates, be it in revenue or earnings, it can indicate an inflection point for the business, which is can often be an opportunity for investors.
The company's revenue and earnings (over time) are depicted in the image below (click to see the exact numbers).
We consider it positive that insiders have made significant purchases in the last year. Even so, future earnings will be far more important to whether current shareholders make money. So it makes a lot of sense to check out what analysts think Full House Resorts will earn in the future (free profit forecasts).
A Different Perspective
Full House Resorts shareholders are down 28% for the year, but the market itself is up 24%. Even the share prices of good stocks drop sometimes, but we want to see improvements in the fundamental metrics of a business, before getting too interested. Longer term investors wouldn't be so upset, since they would have made 19%, each year, over five years. If the fundamental data continues to indicate long term sustainable growth, the current sell-off could be an opportunity worth considering. While it is well worth considering the different impacts that market conditions can have on the share price, there are other factors that are even more important. Consider for instance, the ever-present spectre of investment risk. We've identified 2 warning signs with Full House Resorts (at least 1 which doesn't sit too well with us) , and understanding them should be part of your investment process.
There are plenty of other companies that have insiders buying up shares. You probably do not want to miss this free list of undervalued small cap companies that insiders are buying.
Please note, the market returns quoted in this article reflect the market weighted average returns of stocks that currently trade on American exchanges.
Have feedback on this article? Concerned about the content? Get in touch with us directly. Alternatively, email editorial-team (at) simplywallst.com.
This article by Simply Wall St is general in nature. We provide commentary based on historical data and analyst forecasts only using an unbiased methodology and our articles are not intended to be financial advice. It does not constitute a recommendation to buy or sell any stock, and does not take account of your objectives, or your financial situation. We aim to bring you long-term focused analysis driven by fundamental data. Note that our analysis may not factor in the latest price-sensitive company announcements or qualitative material. Simply Wall St has no position in any stocks mentioned.
