
 Yahoo Finance
 Those who invested in Frontera Energy (TSE:FEC) a year ago are up 63%
Passive investing in index funds can generate returns that roughly match the overall market. But you can significantly boost your returns by picking above-average stocks. For example, the Frontera Energy Corporation (TSE:FEC) share price is up 63% in the last 1 year, clearly besting the market decline of around 1.9% (not including dividends). So that should have shareholders smiling. Unfortunately the longer term returns are not so good, with the stock falling 5.4% in the last three years.
With that in mind, it's worth seeing if the company's underlying fundamentals have been the driver of long term performance, or if there are some discrepancies.
View our latest analysis for Frontera Energy
To paraphrase Benjamin Graham: Over the short term the market is a voting machine, but over the long term it's a weighing machine. One way to examine how market sentiment has changed over time is to look at the interaction between a company's share price and its earnings per share (EPS).
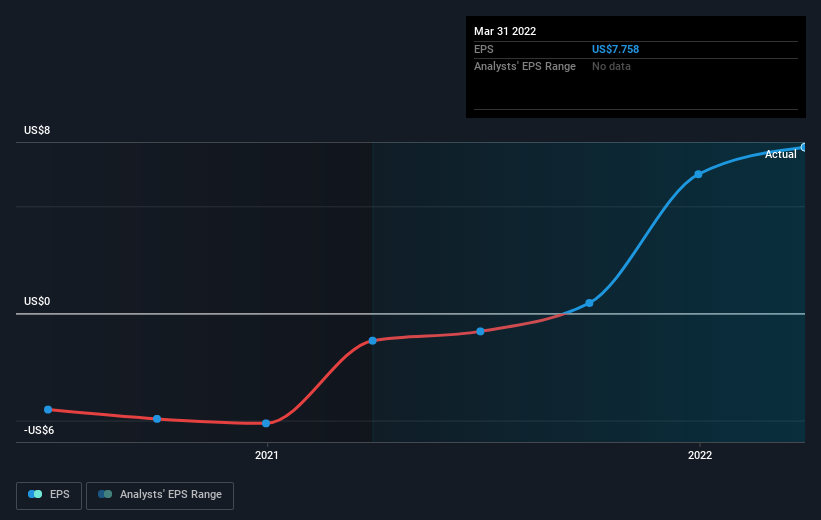
Frontera Energy went from making a loss to reporting a profit, in the last year.
The result looks like a strong improvement to us, so we're not surprised the market likes the growth. Generally speaking the profitability inflection point is a great time to research a company closely, lest you miss an opportunity to profit.
The graphic below depicts how EPS has changed over time (unveil the exact values by clicking on the image).
It is of course excellent to see how Frontera Energy has grown profits over the years, but the future is more important for shareholders. It might be well worthwhile taking a look at our free report on how its financial position has changed over time.
A Different Perspective
It's good to see that Frontera Energy has rewarded shareholders with a total shareholder return of 63% in the last twelve months. There's no doubt those recent returns are much better than the TSR loss of 2% per year over five years. This makes us a little wary, but the business might have turned around its fortunes. I find it very interesting to look at share price over the long term as a proxy for business performance. But to truly gain insight, we need to consider other information, too. For example, we've discovered 1 warning sign for Frontera Energy that you should be aware of before investing here.
If you would prefer to check out another company -- one with potentially superior financials -- then do not miss this free list of companies that have proven they can grow earnings.
Please note, the market returns quoted in this article reflect the market weighted average returns of stocks that currently trade on CA exchanges.
Have feedback on this article? Concerned about the content? Get in touch with us directly. Alternatively, email editorial-team (at) simplywallst.com.
This article by Simply Wall St is general in nature. We provide commentary based on historical data and analyst forecasts only using an unbiased methodology and our articles are not intended to be financial advice. It does not constitute a recommendation to buy or sell any stock, and does not take account of your objectives, or your financial situation. We aim to bring you long-term focused analysis driven by fundamental data. Note that our analysis may not factor in the latest price-sensitive company announcements or qualitative material. Simply Wall St has no position in any stocks mentioned.
Join A Paid User Research Session
You’ll receive a US$30 Amazon Gift card for 1 hour of your time while helping us build better investing tools for the individual investors like yourself. Sign up here
