
 Yahoo Finance
 Those who invested in Floor & Decor Holdings (NYSE:FND) five years ago are up 185%
The most you can lose on any stock (assuming you don't use leverage) is 100% of your money. But on the bright side, you can make far more than 100% on a really good stock. One great example is Floor & Decor Holdings, Inc. (NYSE:FND) which saw its share price drive 185% higher over five years. In the last week the share price is up 1.1%.
So let's investigate and see if the longer term performance of the company has been in line with the underlying business' progress.
Check out our latest analysis for Floor & Decor Holdings
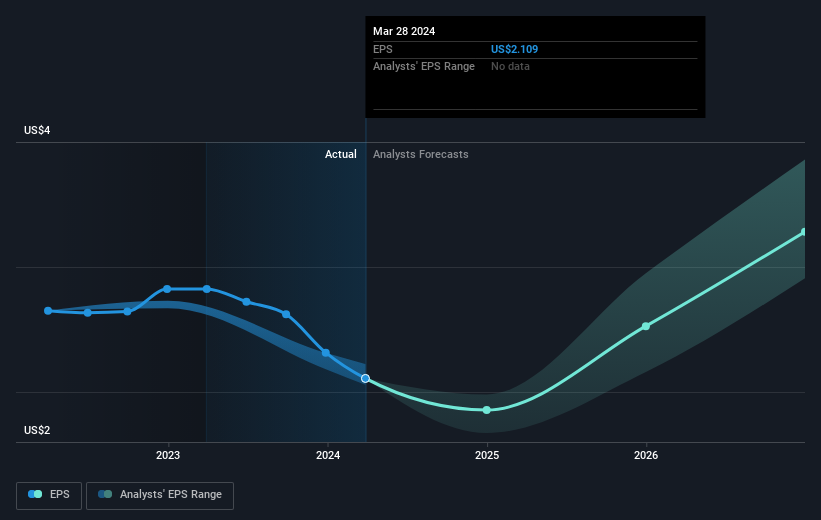
In his essay The Superinvestors of Graham-and-Doddsville Warren Buffett described how share prices do not always rationally reflect the value of a business. One way to examine how market sentiment has changed over time is to look at the interaction between a company's share price and its earnings per share (EPS).
During five years of share price growth, Floor & Decor Holdings achieved compound earnings per share (EPS) growth of 12% per year. This EPS growth is lower than the 23% average annual increase in the share price. So it's fair to assume the market has a higher opinion of the business than it did five years ago. That's not necessarily surprising considering the five-year track record of earnings growth. This optimism is visible in its fairly high P/E ratio of 56.35.
The graphic below depicts how EPS has changed over time (unveil the exact values by clicking on the image).
This free interactive report on Floor & Decor Holdings' earnings, revenue and cash flow is a great place to start, if you want to investigate the stock further.
A Different Perspective
Floor & Decor Holdings provided a TSR of 23% over the year. That's fairly close to the broader market return. It has to be noted that the recent return falls short of the 23% shareholders have gained each year, over half a decade. Although the share price growth has slowed, the longer term story points to a business well worth watching. I find it very interesting to look at share price over the long term as a proxy for business performance. But to truly gain insight, we need to consider other information, too. For instance, we've identified 1 warning sign for Floor & Decor Holdings that you should be aware of.
Of course, you might find a fantastic investment by looking elsewhere. So take a peek at this free list of companies we expect will grow earnings.
Please note, the market returns quoted in this article reflect the market weighted average returns of stocks that currently trade on American exchanges.
Have feedback on this article? Concerned about the content? Get in touch with us directly. Alternatively, email editorial-team (at) simplywallst.com.
This article by Simply Wall St is general in nature. We provide commentary based on historical data and analyst forecasts only using an unbiased methodology and our articles are not intended to be financial advice. It does not constitute a recommendation to buy or sell any stock, and does not take account of your objectives, or your financial situation. We aim to bring you long-term focused analysis driven by fundamental data. Note that our analysis may not factor in the latest price-sensitive company announcements or qualitative material. Simply Wall St has no position in any stocks mentioned.
Have feedback on this article? Concerned about the content? Get in touch with us directly. Alternatively, email editorial-team@simplywallst.com
