
 Yahoo Finance
 Those who invested in Compass Group (LON:CPG) three years ago are up 59%
By buying an index fund, investors can approximate the average market return. But if you choose individual stocks with prowess, you can make superior returns. Just take a look at Compass Group PLC (LON:CPG), which is up 55%, over three years, soundly beating the market return of 23% (not including dividends). On the other hand, the returns haven't been quite so good recently, with shareholders up just 24% , including dividends .
Let's take a look at the underlying fundamentals over the longer term, and see if they've been consistent with shareholders returns.
Check out our latest analysis for Compass Group
While markets are a powerful pricing mechanism, share prices reflect investor sentiment, not just underlying business performance. One imperfect but simple way to consider how the market perception of a company has shifted is to compare the change in the earnings per share (EPS) with the share price movement.
During the three years of share price growth, Compass Group actually saw its earnings per share (EPS) drop 3.8% per year.
Based on these numbers, we think that the decline in earnings per share may not be a good representation of how the business has changed over the years. So other metrics may hold the key to understanding what is influencing investors.
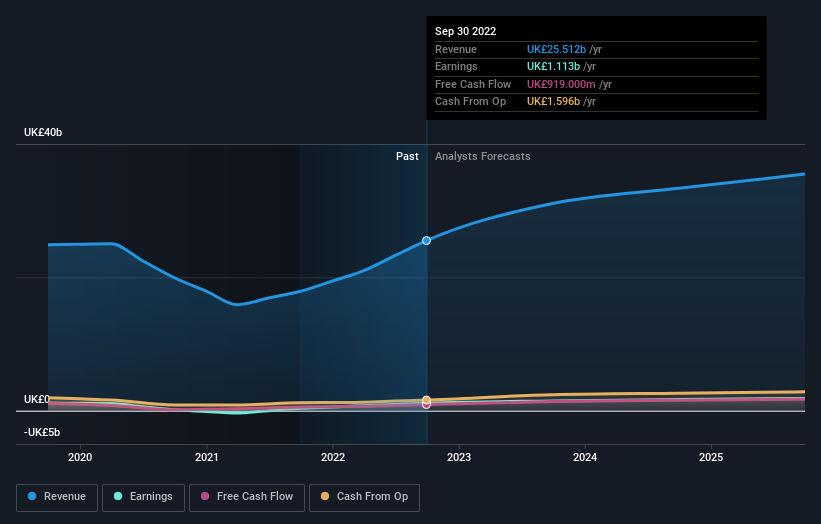
The modest 1.5% dividend yield is unlikely to be propping up the share price. The revenue drop of 3.7% is as underwhelming as some politicians. The only thing that's clear is there is low correlation between Compass Group's share price and its historic fundamental data. Further research may be required!
The company's revenue and earnings (over time) are depicted in the image below (click to see the exact numbers).
Compass Group is well known by investors, and plenty of clever analysts have tried to predict the future profit levels. Given we have quite a good number of analyst forecasts, it might be well worth checking out this free chart depicting consensus estimates.
What About Dividends?
When looking at investment returns, it is important to consider the difference between total shareholder return (TSR) and share price return. The TSR is a return calculation that accounts for the value of cash dividends (assuming that any dividend received was reinvested) and the calculated value of any discounted capital raisings and spin-offs. It's fair to say that the TSR gives a more complete picture for stocks that pay a dividend. We note that for Compass Group the TSR over the last 3 years was 59%, which is better than the share price return mentioned above. And there's no prize for guessing that the dividend payments largely explain the divergence!
A Different Perspective
It's good to see that Compass Group has rewarded shareholders with a total shareholder return of 24% in the last twelve months. And that does include the dividend. That gain is better than the annual TSR over five years, which is 8%. Therefore it seems like sentiment around the company has been positive lately. Given the share price momentum remains strong, it might be worth taking a closer look at the stock, lest you miss an opportunity. I find it very interesting to look at share price over the long term as a proxy for business performance. But to truly gain insight, we need to consider other information, too. For example, we've discovered 1 warning sign for Compass Group that you should be aware of before investing here.
Of course Compass Group may not be the best stock to buy. So you may wish to see this free collection of growth stocks.
Please note, the market returns quoted in this article reflect the market weighted average returns of stocks that currently trade on British exchanges.
Have feedback on this article? Concerned about the content? Get in touch with us directly. Alternatively, email editorial-team (at) simplywallst.com.
This article by Simply Wall St is general in nature. We provide commentary based on historical data and analyst forecasts only using an unbiased methodology and our articles are not intended to be financial advice. It does not constitute a recommendation to buy or sell any stock, and does not take account of your objectives, or your financial situation. We aim to bring you long-term focused analysis driven by fundamental data. Note that our analysis may not factor in the latest price-sensitive company announcements or qualitative material. Simply Wall St has no position in any stocks mentioned.
Join A Paid User Research Session
You’ll receive a US$30 Amazon Gift card for 1 hour of your time while helping us build better investing tools for the individual investors like yourself. Sign up here