
 Yahoo Finance
 Those who invested in Coles Group (ASX:COL) three years ago are up 25%
Low-cost index funds make it easy to achieve average market returns. But if you invest in individual stocks, some are likely to underperform. For example, the Coles Group Limited (ASX:COL) share price return of 12% over three years lags the market return in the same period. At least the stock price is up over the last year, albeit only by 0.8%.
With that in mind, it's worth seeing if the company's underlying fundamentals have been the driver of long term performance, or if there are some discrepancies.
See our latest analysis for Coles Group
In his essay The Superinvestors of Graham-and-Doddsville Warren Buffett described how share prices do not always rationally reflect the value of a business. One flawed but reasonable way to assess how sentiment around a company has changed is to compare the earnings per share (EPS) with the share price.
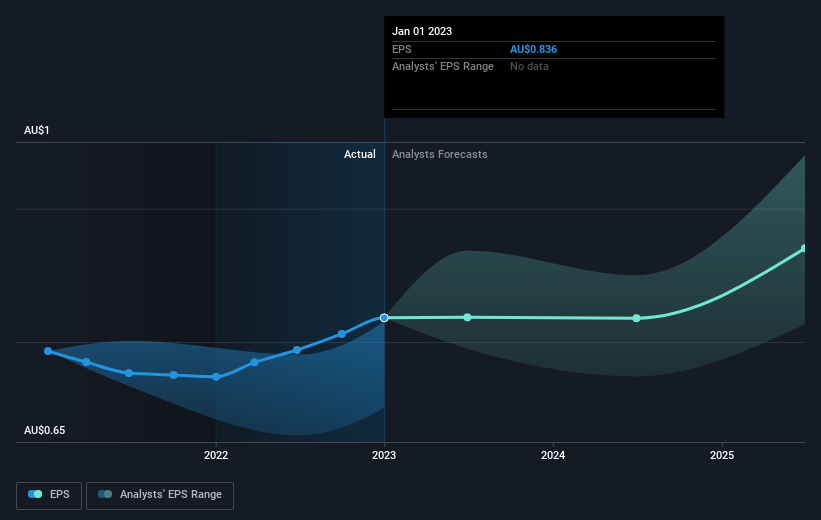
During the three years of share price growth, Coles Group actually saw its earnings per share (EPS) drop 2.1% per year.
The comparison of the modestly falling earnings per share, and the relatively resilient share price, suggests the market is less cautious about the stock, these days. Having said that, if the EPS falls continue we'd be surprised to see a sustained increase in share price.
The company's earnings per share (over time) is depicted in the image below (click to see the exact numbers).
We like that insiders have been buying shares in the last twelve months. Having said that, most people consider earnings and revenue growth trends to be a more meaningful guide to the business. Dive deeper into the earnings by checking this interactive graph of Coles Group's earnings, revenue and cash flow.
What About Dividends?
It is important to consider the total shareholder return, as well as the share price return, for any given stock. The TSR incorporates the value of any spin-offs or discounted capital raisings, along with any dividends, based on the assumption that the dividends are reinvested. It's fair to say that the TSR gives a more complete picture for stocks that pay a dividend. We note that for Coles Group the TSR over the last 3 years was 25%, which is better than the share price return mentioned above. And there's no prize for guessing that the dividend payments largely explain the divergence!
A Different Perspective
We're pleased to report that Coles Group rewarded shareholders with a total shareholder return of 4.6% over the last year. That includes the value of the dividend. That falls short of the 8% it has made, for shareholders, each year, over three years. While it is well worth considering the different impacts that market conditions can have on the share price, there are other factors that are even more important. For instance, we've identified 1 warning sign for Coles Group that you should be aware of.
Coles Group is not the only stock that insiders are buying. For those who like to find winning investments this free list of growing companies with recent insider purchasing, could be just the ticket.
Please note, the market returns quoted in this article reflect the market weighted average returns of stocks that currently trade on Australian exchanges.
Have feedback on this article? Concerned about the content? Get in touch with us directly. Alternatively, email editorial-team (at) simplywallst.com.
This article by Simply Wall St is general in nature. We provide commentary based on historical data and analyst forecasts only using an unbiased methodology and our articles are not intended to be financial advice. It does not constitute a recommendation to buy or sell any stock, and does not take account of your objectives, or your financial situation. We aim to bring you long-term focused analysis driven by fundamental data. Note that our analysis may not factor in the latest price-sensitive company announcements or qualitative material. Simply Wall St has no position in any stocks mentioned.
Join A Paid User Research Session
You’ll receive a US$30 Amazon Gift card for 1 hour of your time while helping us build better investing tools for the individual investors like yourself. Sign up here
