
 Yahoo Finance
 Those who invested in Arrow Exploration (CVE:AXL) three years ago are up 150%
It might be of some concern to shareholders to see the Arrow Exploration Corp. (CVE:AXL) share price down 15% in the last month. But that doesn't undermine the rather lovely longer-term return, if you measure over the last three years. Indeed, the share price is up a very strong 150% in that time. After a run like that some may not be surprised to see prices moderate. The thing to consider is whether the underlying business is doing well enough to support the current price.
Let's take a look at the underlying fundamentals over the longer term, and see if they've been consistent with shareholders returns.
View our latest analysis for Arrow Exploration
In his essay The Superinvestors of Graham-and-Doddsville Warren Buffett described how share prices do not always rationally reflect the value of a business. One way to examine how market sentiment has changed over time is to look at the interaction between a company's share price and its earnings per share (EPS).
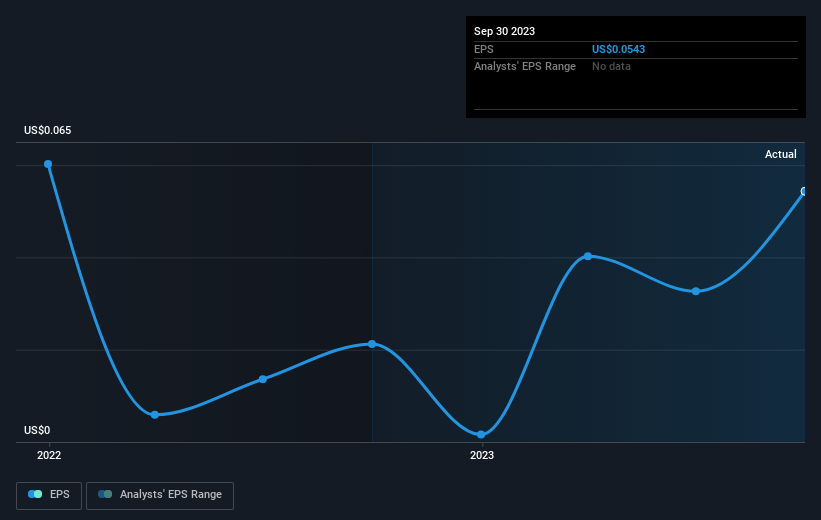
Arrow Exploration became profitable within the last three years. Given the importance of this milestone, it's not overly surprising that the share price has increased strongly.
You can see how EPS has changed over time in the image below (click on the chart to see the exact values).
We know that Arrow Exploration has improved its bottom line over the last three years, but what does the future have in store? You can see how its balance sheet has strengthened (or weakened) over time in this free interactive graphic.
A Different Perspective
We're pleased to report that Arrow Exploration shareholders have received a total shareholder return of 32% over one year. Since the one-year TSR is better than the five-year TSR (the latter coming in at 7% per year), it would seem that the stock's performance has improved in recent times. Someone with an optimistic perspective could view the recent improvement in TSR as indicating that the business itself is getting better with time. It's always interesting to track share price performance over the longer term. But to understand Arrow Exploration better, we need to consider many other factors. For example, we've discovered 3 warning signs for Arrow Exploration (1 shouldn't be ignored!) that you should be aware of before investing here.
For those who like to find winning investments this free list of growing companies with recent insider purchasing, could be just the ticket.
Please note, the market returns quoted in this article reflect the market weighted average returns of stocks that currently trade on Canadian exchanges.
Have feedback on this article? Concerned about the content? Get in touch with us directly. Alternatively, email editorial-team (at) simplywallst.com.
This article by Simply Wall St is general in nature. We provide commentary based on historical data and analyst forecasts only using an unbiased methodology and our articles are not intended to be financial advice. It does not constitute a recommendation to buy or sell any stock, and does not take account of your objectives, or your financial situation. We aim to bring you long-term focused analysis driven by fundamental data. Note that our analysis may not factor in the latest price-sensitive company announcements or qualitative material. Simply Wall St has no position in any stocks mentioned.
