
 Yahoo Finance
 Those who invested in ARC Document Solutions (NYSE:ARC) three years ago are up 40%
While ARC Document Solutions, Inc. (NYSE:ARC) shareholders are probably generally happy, the stock hasn't had particularly good run recently, with the share price falling 15% in the last quarter. In contrast the stock is up over the last three years. Arguably you'd have been better off buying an index fund, because the gain of 17% in three years isn't amazing.
So let's assess the underlying fundamentals over the last 3 years and see if they've moved in lock-step with shareholder returns.
Check out our latest analysis for ARC Document Solutions
To paraphrase Benjamin Graham: Over the short term the market is a voting machine, but over the long term it's a weighing machine. One flawed but reasonable way to assess how sentiment around a company has changed is to compare the earnings per share (EPS) with the share price.
ARC Document Solutions was able to grow its EPS at 9.8% per year over three years, sending the share price higher. The average annual share price increase of 6% is actually lower than the EPS growth. So one could reasonably conclude that the market has cooled on the stock.
You can see below how EPS has changed over time (discover the exact values by clicking on the image).
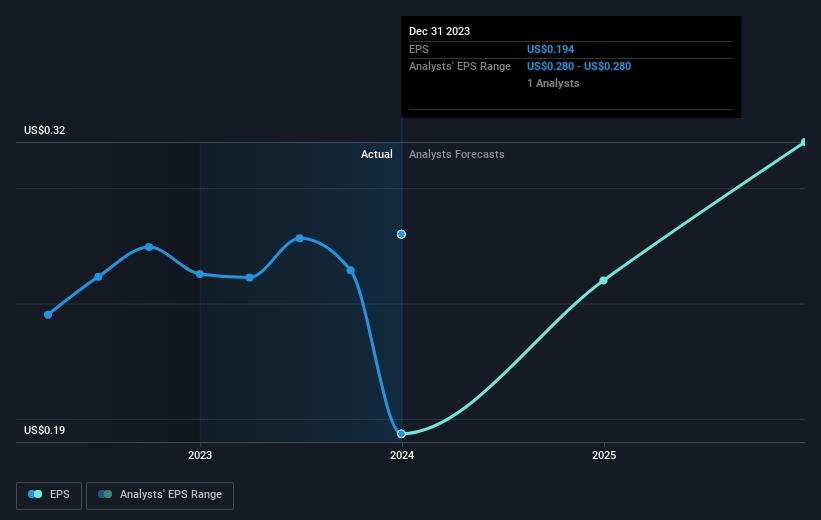
Dive deeper into ARC Document Solutions' key metrics by checking this interactive graph of ARC Document Solutions's earnings, revenue and cash flow.
What About Dividends?
As well as measuring the share price return, investors should also consider the total shareholder return (TSR). Whereas the share price return only reflects the change in the share price, the TSR includes the value of dividends (assuming they were reinvested) and the benefit of any discounted capital raising or spin-off. It's fair to say that the TSR gives a more complete picture for stocks that pay a dividend. As it happens, ARC Document Solutions' TSR for the last 3 years was 40%, which exceeds the share price return mentioned earlier. The dividends paid by the company have thusly boosted the total shareholder return.
A Different Perspective
Investors in ARC Document Solutions had a tough year, with a total loss of 9.3% (including dividends), against a market gain of about 27%. Even the share prices of good stocks drop sometimes, but we want to see improvements in the fundamental metrics of a business, before getting too interested. Longer term investors wouldn't be so upset, since they would have made 5%, each year, over five years. If the fundamental data continues to indicate long term sustainable growth, the current sell-off could be an opportunity worth considering. It's always interesting to track share price performance over the longer term. But to understand ARC Document Solutions better, we need to consider many other factors. Consider risks, for instance. Every company has them, and we've spotted 1 warning sign for ARC Document Solutions you should know about.
Of course, you might find a fantastic investment by looking elsewhere. So take a peek at this free list of companies we expect will grow earnings.
Please note, the market returns quoted in this article reflect the market weighted average returns of stocks that currently trade on American exchanges.
Have feedback on this article? Concerned about the content? Get in touch with us directly. Alternatively, email editorial-team (at) simplywallst.com.
This article by Simply Wall St is general in nature. We provide commentary based on historical data and analyst forecasts only using an unbiased methodology and our articles are not intended to be financial advice. It does not constitute a recommendation to buy or sell any stock, and does not take account of your objectives, or your financial situation. We aim to bring you long-term focused analysis driven by fundamental data. Note that our analysis may not factor in the latest price-sensitive company announcements or qualitative material. Simply Wall St has no position in any stocks mentioned.
