
 Yahoo Finance
 Thinking holistically about finances to avoid bad habits
Note: A version of this post first appeared on TKer.co.
Stocks ticked lower last week with the S&P 500 shedding 0.2% to close at 4,450.32. The index is now up 15.9% year to date, up 24.4% from its October 12 closing low of 3,577.03, and down 7.2% from its January 3, 2022 record closing high of 4,796.56.
I spent the past week at FutureProof and Excell, two leading industry conferences for financial advisors.
I like attending events like these because I inevitably meet people I’d probably never cross paths with under normal circumstances. That means I get exposed to a wide array of views, some of which might affect the way I think about things.
One topic that came up in many of my conversations was holistic thinking.
When you think about your financial situation holistically, you realize it isn’t characterized just by the assets you hold in your portfolio, but also the industry in which you work. For example, you may be a young professional with a little bit of savings conservatively invested in a broadly diversified S&P 500 index fund. But if you work at a VC-backed startup and it’s your only source of income, then you are far more financially exposed to speculative risk than your 401(k) statements might suggest.
Speaking more broadly, it’s always treacherous to consider any piece of data in isolation. In the markets and the economy, there almost isn’t enough context to take into account when considering specific metrics.
The richer you get, the less you need to save
One unsettling metric that often gets misinterpreted and taken out of context is the personal saving rate — the percentage of disposable income that’s saved, not spent — which has been trending below pre-pandemic levels over the past two years.

Does a low saving rate mean households are going broke as they use more of their incomes for spending instead of saving?
The short answer is no. As we’ve discussed repeatedly at TKer, household finances are quite strong. People have money.
In fact, a declining saving rate may be a reflection of household finances getting even stronger.
Renaissance Macro’s Neil Dutta recently reviewed the historical relationship between the personal saving rate and net worth. His findings were a bit counterintuitive.
"From the 1980s to 2000s, there was a pretty neat and clean relationship: as net worth rose relative to income, the household saving rate declined," Dutta observed in a September 8 note. "This made sense as households saw rising asset values as a low risk form of wealth creation. When you are ‘loaded,’ you have less reason to save."
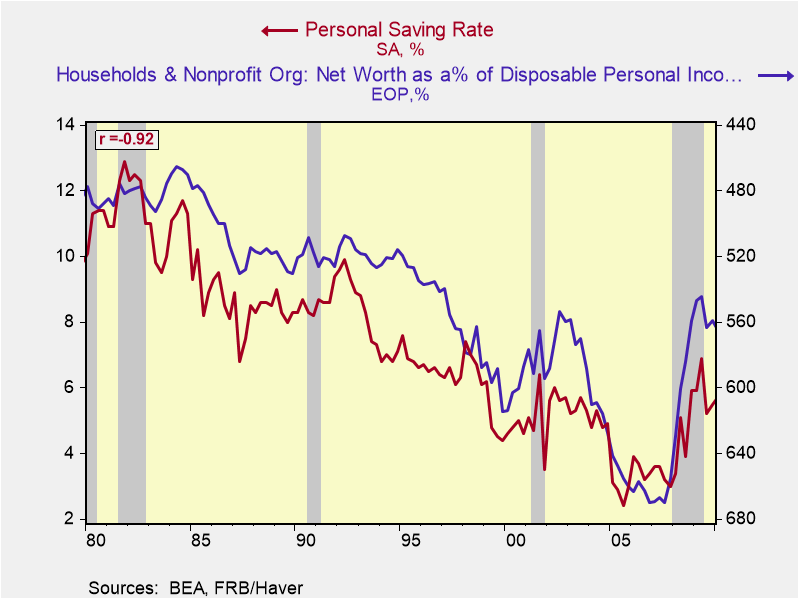
This relationship broke down in the wake of the global financial crisis.
"While net worth rose relative to incomes, the saving rate ended up rising about 2ppts over the decade, ending close to 9% in 2019," Dutta noted. "Households were highly sensitive to the previous asset deflation, boom-bust, and rising asset prices, while welcomed, did not build the confidence in folks to actually save less (after all, household balance sheets needed to be repaired)."
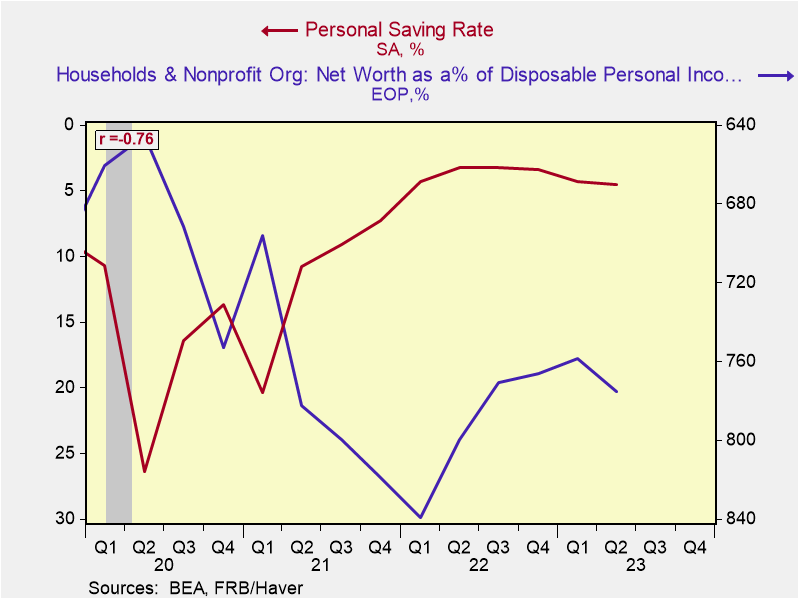
However, Dutta now argues that we may be returning to that pre-financial crisis trend, with home prices near record levels and stock prices rising sharply from their lows.
"If my stock portfolio is rising and home prices are climbing, I don't feel like I need to be saving as much," he said (emphasis added). "This would be an argument supporting the idea that there is not anything ‘wrong’ with a saving rate at 3.5%. Moreover, it is not immediately clear why people need to take their savings rates up to pre-pandemic levels either."
It’s never ceteris paribus
Ceteris paribus — Latin for "all other things being equal" — a falling saving rate doesn’t seem like good news.
But as we often see, things are never ceteris paribus. Read more here and here.
Similar to when companies face challenges, the question is not whether a development is bad. Rather, the question is whether companies can keep earnings growing despite the development.
With regard to household finances, the question is not whether a falling saving rate in itself is bad. Rather, the question is: Does this mean household finances are deteriorating?
The world is complex. But it can be complex in good ways. Because sometimes something might seem bad, when in reality that something might actually reflect something good.
What the UAW strike could mean for the economy
Workers at Detroit’s big three automakers went on strike on Friday. The strikes are currently limited to three assembly plants. Here are some relevant stats and estimates from Wall Street analysts (emphasis added):
"Ongoing negotiations will affect up to 146,000 UAW members in the industry, which represents about 13.6% of the overall employment in the motor vehicle and parts manufacturing in the US, but only around 1% of overall manufacturing employment and about 0.1% of total employment in the private sector. The auto industry generates around 6% of the aggregate industrial production and almost 8% of the overall manufacturing output."- JPMorgan
"In 2019, a limited strike (48k workers - 24% of motor vehicle production employment at the time) started in mid-September and lasted through October. The decline in motor vehicle production subtracted 0.4pp at an annual rate from 4Q real GDP growth. If this strike lasts as long and extends to all 146k union members, the impact could be almost one full point drag on GDP growth. For context, our current forecast for just 0.1% 4Q GDP growth would be closer to a decline of 1.0% in that scenario, pulling down 2023 GDP growth from 1.7% 4Q/4Q to 1.4%" - Morgan Stanley
"We estimate a strike covering all workers would directly reduce US GDP by 0.2%-0.3% due to a 30% decline in motor vehicle output for the duration of the strike. That impact would begin to show up in the September industrial production report. But because of the way the data are calculated, any hit to payrolls wouldn't come until October. Assuming the strike ended within 4-6 weeks, there would probably be enough time for output to rebound before the end of the quarter, meaning the impact on Q4 GDP would be negligible" - Oxford Economics
"We estimate that a full strike by all three manufacturers would likely be a drag on GDP growth of roughly 0.1 to 0.2ppt per week. If the strike were to last an entire quarter, it could drag down GDP growth by 1.6 to 2.1ppt. However, it's unlikely that it will last a full quarter given a finite UAW strike fund and experience from previous strikes." - Bank of America
"[W]e estimate that lower auto production from a potential UAW strike would reduce quarterly annualized growth by 0.05-0.10pp for each week it lasted if it impacts all three companies currently undergoing contract negotiations." - Goldman Sachs
Reviewing the macro crosscurrents
There were a few notable data points and macroeconomic developments from last week to consider:
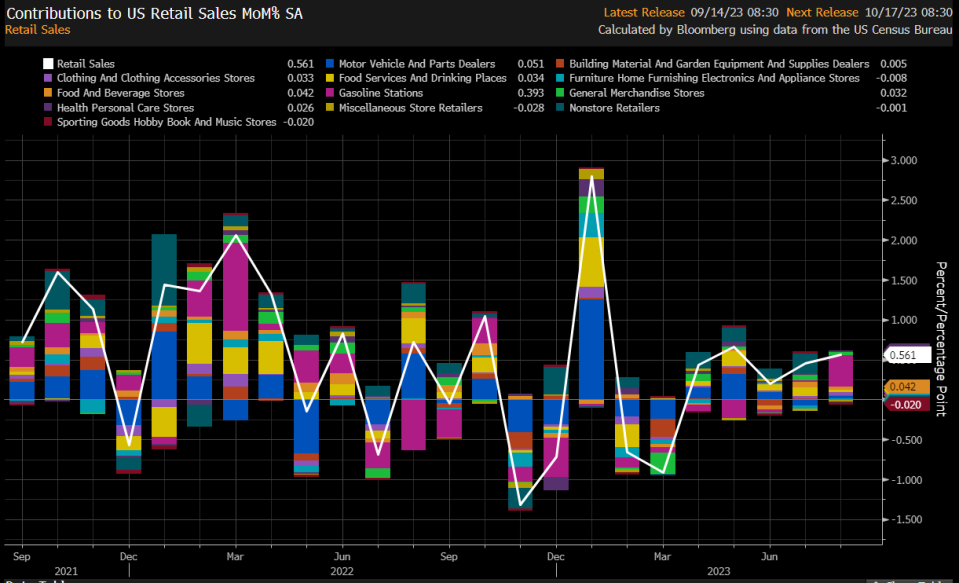
Consumers are spending. According to Census Bureau data released Thursday, retail sales in August increased by 0.6% to a record $697.6 billion. Higher energy prices played a significant role, as gas station sales jumped by 5.2%. But even if you exclude autos and gas, which can be pretty volatile over short-term periods, retail sales still rose by 0.2%.

Most retail categories grew, including clothing, electronics, health and personal care, grocery, and restaurants and bars.
Spending is holding up, according to September card data. From JPMorgan Chase: "As of 10 Sep 2023, our Chase Consumer Card spending data (unadjusted) was 1.8% above the same day last year. Based on the Chase Consumer Card data through 10 Sep 2023, our estimate of the US Census September control measure of retail sales m/m is 0.29%."

Consumers have spending power. From Bank of America: "Overall, consumers still have 'dry powder' to support their spending. Credit card utilization rates have risen, but remain below pre-pandemic levels."

More from Bank of America: "Average credit card balances are above 2019 levels for lower income households, but their wage growth has also been strong."
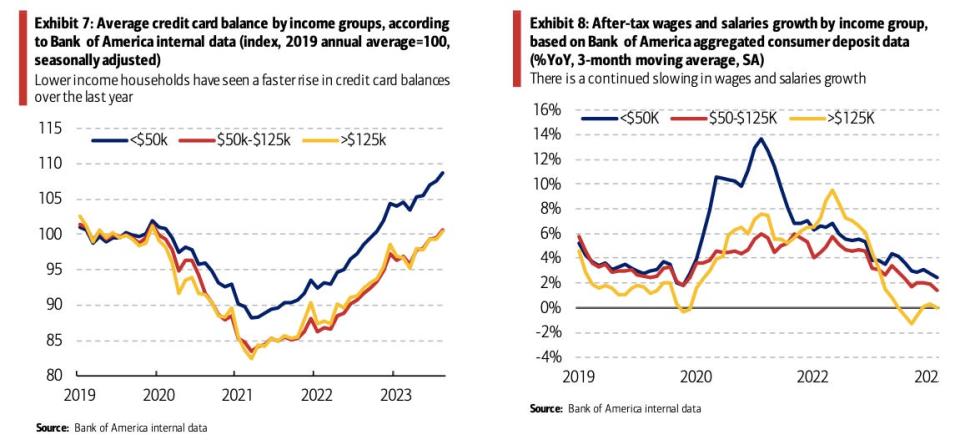
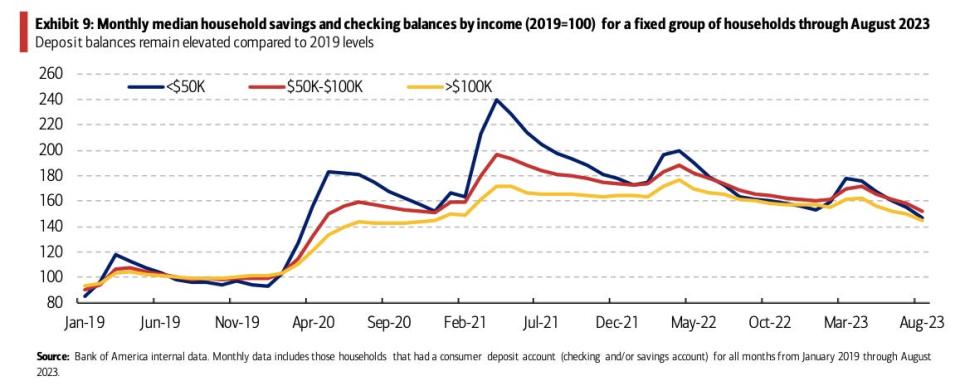
More: "In our view, there continues to be dry powder on the asset side of consumer balance sheets, too. Looking at the latest Bank of America median household savings and checking balances data, deposit balances continue to be elevated relative to pre-pandemic levels, but are trending downwards across all income groups."
Don’t worry about rising credit card balance. Much has been made about revolving consumer credit, which is mostly credit card debt, rising to record levels. But as a percentage of disposable income, credit card debt is actually relatively low.
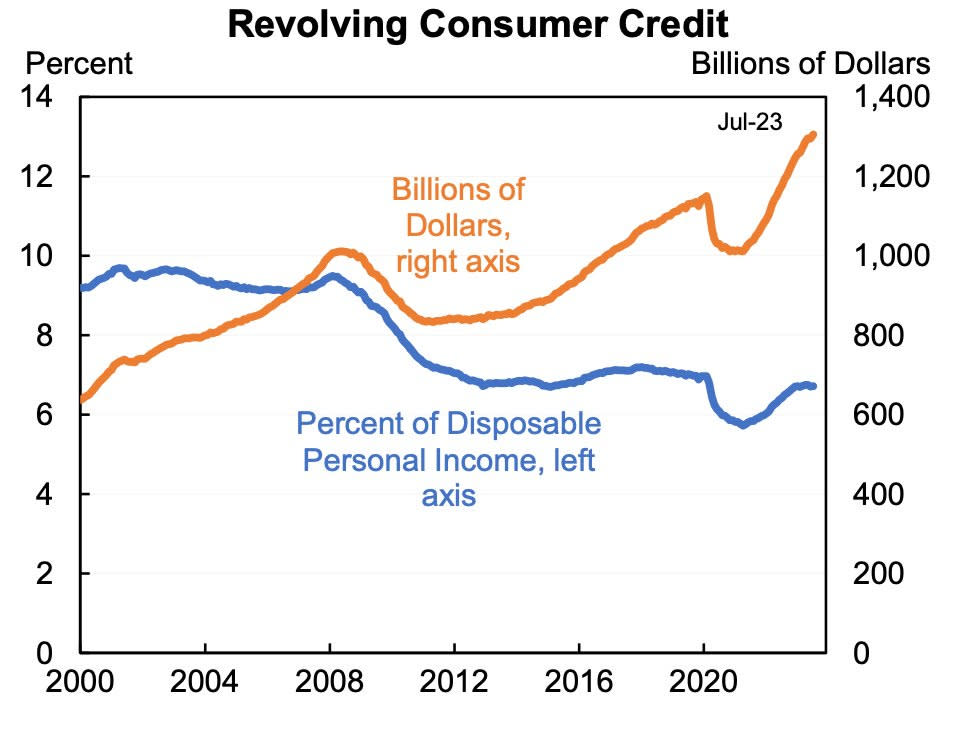
As Behavioral Macro’s Mark Dow says: "If someone doesn’t scale time series like credit or debt by some kind of capacity to pay variable, filter them out. They can’t be trusted. At best they don’t know; more likely they’re trying to mislead you."
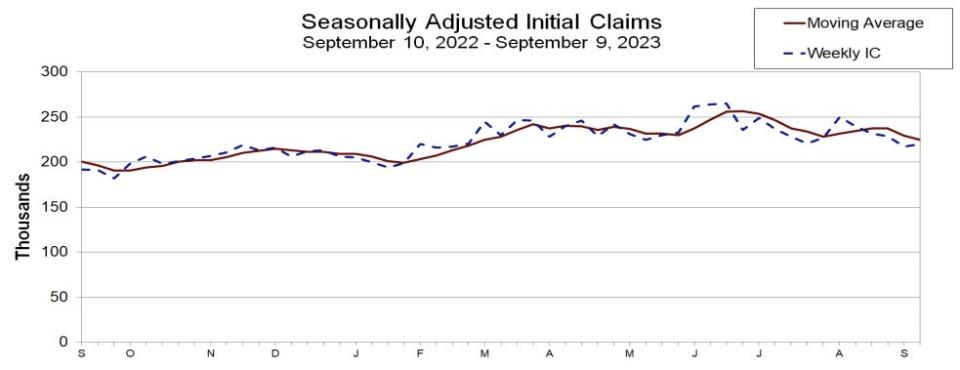
Unemployment claims tick up. Initial claims for unemployment benefits rose to 220,000 during the week ending September 9, up from 216,000 the week prior. While this is up from the September 2022 low of 182,000, it continues to trend at levels associated with economic growth.
Inflation cools. The Consumer Price Index (CPI) in August was up 3.7% from a year ago. Adjusted for food and energy prices, core CPI was up 4.3%, the lowest since October 2021.

On a month-over-month basis, CPI was up 0.6%, driven by a 5.6% jump in energy prices. Core CPI was up 0.3%.
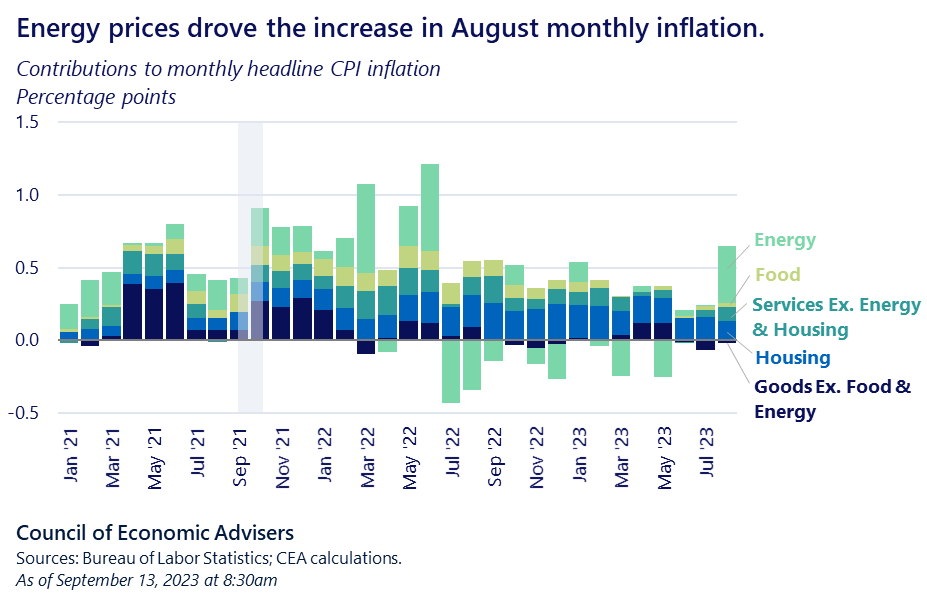
If you annualize the three-month trend in the monthly figures, core CPI is climbing at a 2.4% rate.

Here’s Wells Fargo on the August CPI report: "Despite stronger monthly gains in the headline and core CPI in August, the trend in inflation has downshifted since the spring. The core CPI has slowed to 4.4% year-over-year, with the three month annualized rate of 2.4% showing momentum has slowed further in recent months. We expect the recent downshift will keep the Fed on hold for the foreseeable future, but with price growth still running in excess of 2%, rate cuts remain some ways out."
The bottom line is that while inflation rates have been trending lower, many measures continue to be above the Federal Reserve’s target rate of 2%.
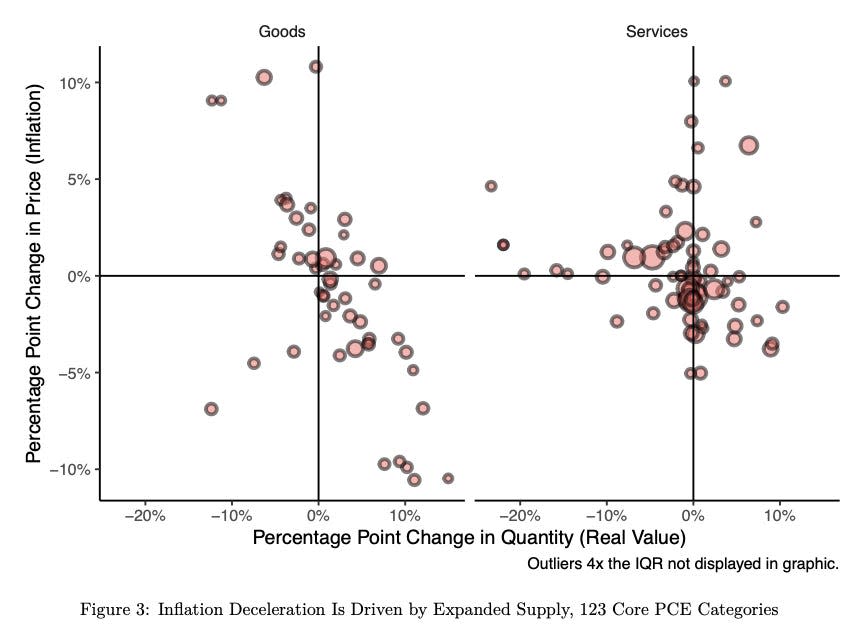
Thank supply improvements for cooling inflation. From Roosevelt Institute’s Mike Konczal (H/T Joe Weisenthal): "Decomposing price and quantity changes for 123 core PCE items, I find 73% of all core items, and 66% of services, see prices falling with quantities increasing — a sign of expanding supply."
Gas prices are up from a year ago. From AAA: "Today’s national average of $3.85 is the same as a month ago but 15 cents more than a year ago."

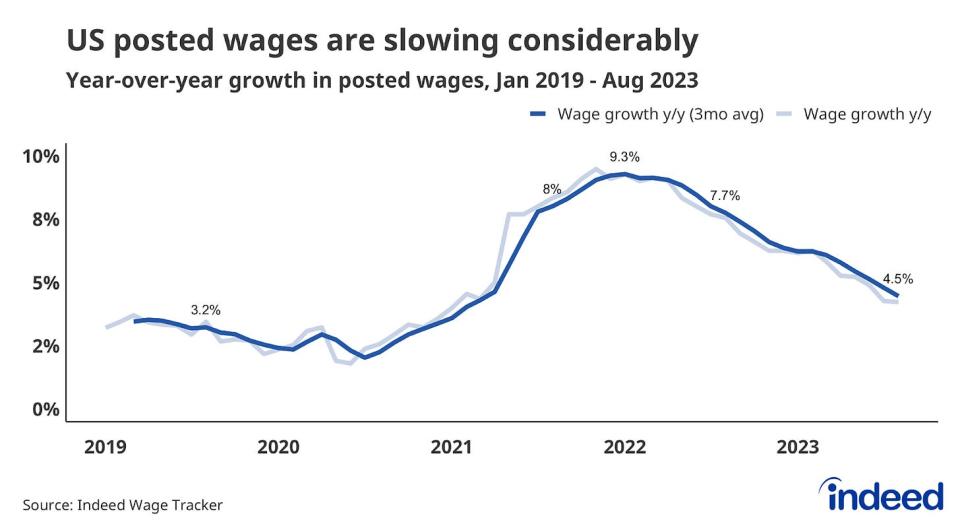
Wage growth is cooling. From the Indeed Hiring Lab: "The latest data from the Indeed Wage Tracker shows that US posted wages grew 4.5% year-over-year in August 2023, less than half their recent top speed of 9.3% in January 2022. At its current rate of slowing, posted wage growth would return to its 2019 average of 3.1% late this year or early in 2024. The slowdown is broad-based as almost 80% of occupational sectors have wage growth lower than 6 months ago."
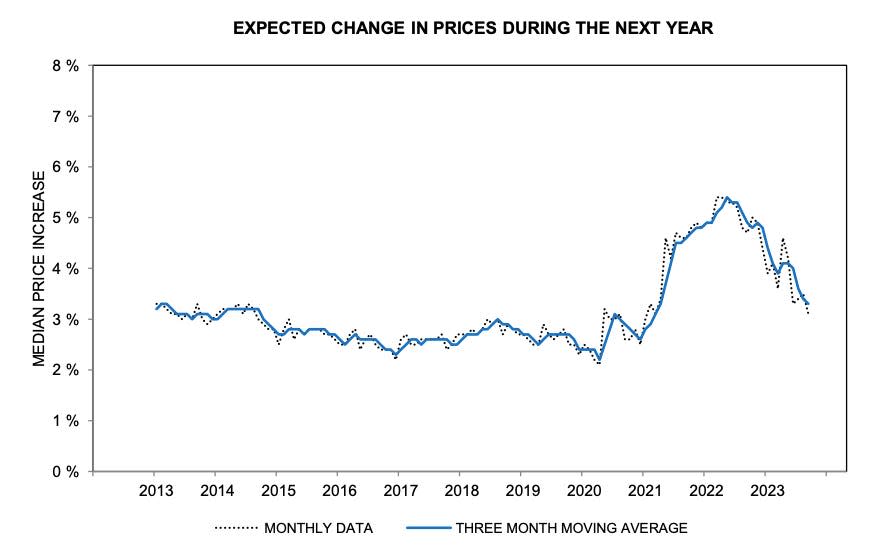
Consumers’ outlook for inflation cools. From the University of Michigan’s September Survey of Consumers: "Year-ahead inflation expectations moderated from 3.5% last month to 3.1% this month. The current reading is the lowest since March 2021 and is just above the 2.3-3.0% range seen in the two years prior to the pandemic. Long-run inflation expectations came in at 2.7%, falling below the narrow 2.9-3.1% range for only the second time in the last 26 months. In comparison, long-run inflation expectations ranged between 2.2 and 2.6% in the two years pre-pandemic."
The New York Fed’s August Survey of Consumer Expectations was a bit more mixed. From their report: "Median one- and five-year-ahead inflation expectations rose slightly in August, both increasing by 0.1 percentage point to 3.6% and 3.0%, respectively. Conversely, three-year-ahead inflation expectations declined by 0.1 percentage point to 2.8%."

The banks are working fine. From Goldman Sachs: "Management concerns about bank credit availability have faded significantly. Just 7% of Russell 3000 conference calls mentioned credit access, roughly the pre-SVB level and down from 15% in the spring. The comments were also significantly less negative, as only a third of references pointed to tighter loan availability (vs. 55% in the spring), and the bulk of those comments were in the real estate sector."

Small business optimism ticks lower. The NFIB’s Small Business Optimism Index declined in August after three months of gains.
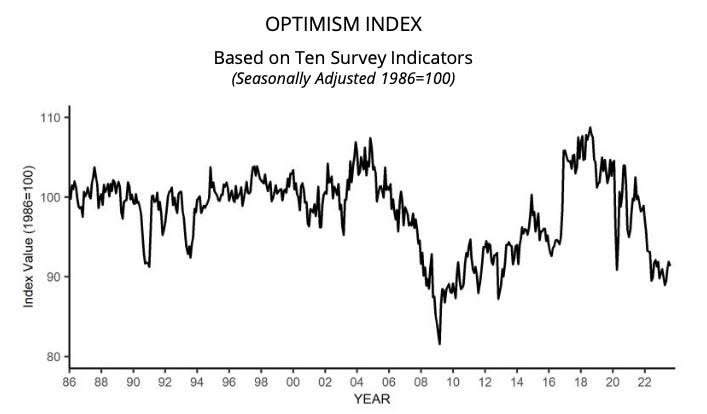
Importantly, the more tangible "hard" components of the index continue to hold up much better than the more sentiment-oriented "soft" components.
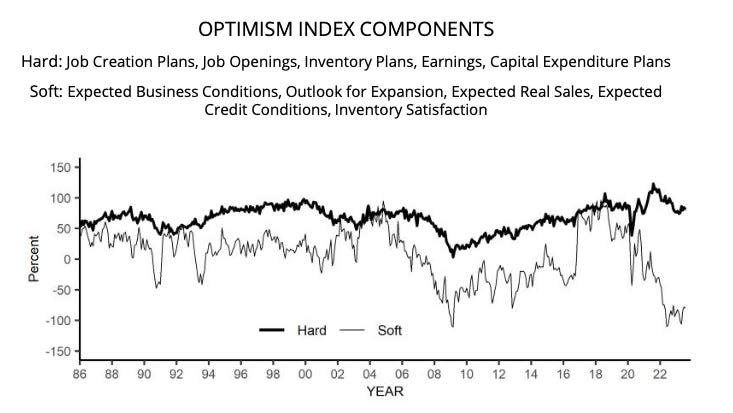
Keep in mind that during times of stress, soft data tends to be more exaggerated than actual hard data.
The pros are worried about stuff. According to BofA’s September Global Fund Manager Survey, fund managers continued to identify high inflation keeping central banks hawkish as the "biggest tail risk."
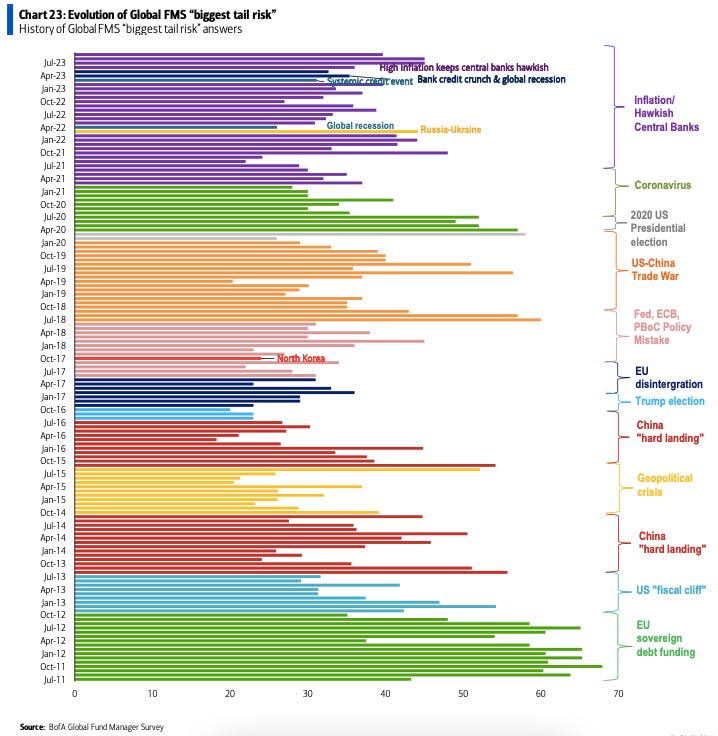
The truth is we’re always worried about something. That’s just the nature of investing.
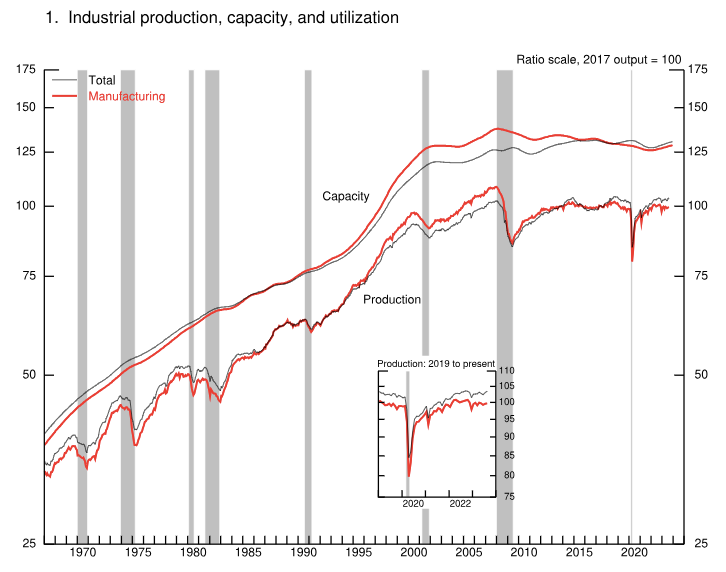
Industrial activity rises. Industrial production activity in August increased 0.4% from July levels, with manufacturing output rising 0.1%.
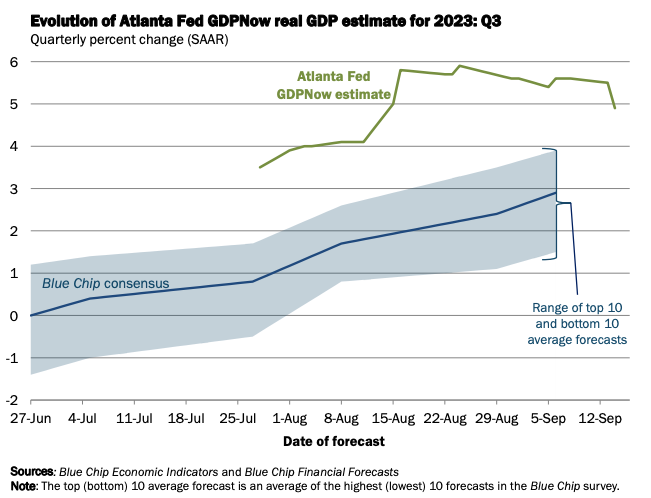
Near-term GDP growth estimates remain positive. The Atlanta Fed’s GDPNow model sees real GDP growth climbing at a 4.9% rate in Q3.
Putting it all together
We continue to get evidence that we could see a bullish "Goldilocks" soft landing scenario where inflation cools to manageable levels without the economy having to sink into recession.
The Federal Reserve has taken a less hawkish tone for most of 2023, with Chair Jerome Powell acknowledging on February 1 that "for the first time the disinflationary process has started." At its June 14 policy meeting, the Fed kept rates unchanged, ending a streak of 10 consecutive rate hikes. While the central bank lifted rates again on July 26, most economists agree that the final rate hike of the cycle has either already happened or is near.
In any case, inflation still has to cool more before the Fed is comfortable with price levels. So we should expect the central bank to keep monetary policy tight, which means we should be prepared for tight financial conditions (e.g., higher interest rates, tighter lending standards, and lower stock valuations) to linger.
All this means monetary policy will be unfriendly to markets for the time being, and the risk the economy slips into a recession will be relatively elevated.
At the same time, we also know that stocks are discounting mechanisms, meaning that prices will have bottomed before the Fed signals a major dovish turn in monetary policy.
Also, it’s important to remember that while recession risks may be elevated, consumers are coming from a very strong financial position. Unemployed people are getting jobs. Those with jobs are getting raises. And many still have excess savings to tap into. Indeed, strong spending data confirms this financial resilience. So it’s too early to sound the alarm from a consumption perspective.
At this point, any downturn is unlikely to turn into economic calamity, given that the financial health of consumers and businesses remains very strong.
And as always, long-term investors should remember that recessions and bear markets are just part of the deal when you enter the stock market with the aim of generating long-term returns. While markets have had a pretty rough couple of years, the long-run outlook for stocks remains positive.
Note: A version of this post first appeared on TKer.co.
