
 Yahoo Finance
 We Think Thermal Energy International (CVE:TMG) Can Stay On Top Of Its Debt
Warren Buffett famously said, 'Volatility is far from synonymous with risk.' So it might be obvious that you need to consider debt, when you think about how risky any given stock is, because too much debt can sink a company. Importantly, Thermal Energy International Inc. (CVE:TMG) does carry debt. But the real question is whether this debt is making the company risky.
When Is Debt A Problem?
Generally speaking, debt only becomes a real problem when a company can't easily pay it off, either by raising capital or with its own cash flow. If things get really bad, the lenders can take control of the business. However, a more common (but still painful) scenario is that it has to raise new equity capital at a low price, thus permanently diluting shareholders. Having said that, the most common situation is where a company manages its debt reasonably well - and to its own advantage. When we examine debt levels, we first consider both cash and debt levels, together.
View our latest analysis for Thermal Energy International
How Much Debt Does Thermal Energy International Carry?
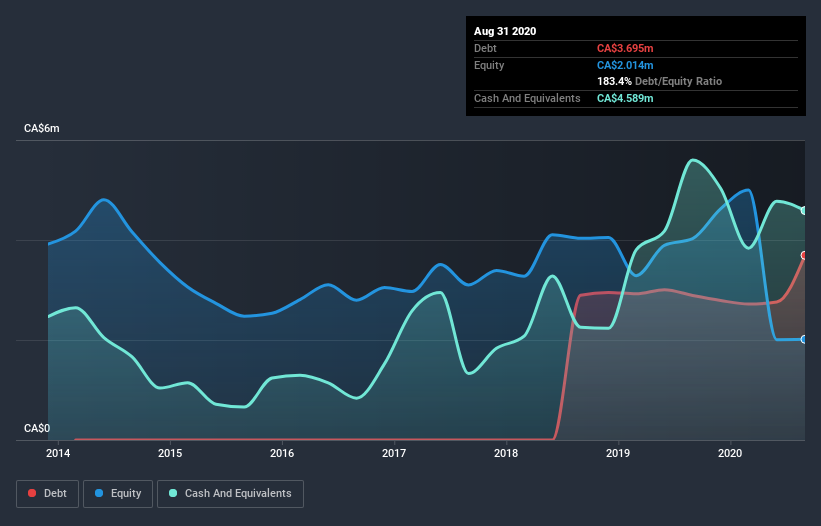
The image below, which you can click on for greater detail, shows that at August 2020 Thermal Energy International had debt of CA$3.69m, up from CA$2.89m in one year. But on the other hand it also has CA$4.59m in cash, leading to a CA$894.8k net cash position.
How Healthy Is Thermal Energy International's Balance Sheet?
We can see from the most recent balance sheet that Thermal Energy International had liabilities of CA$4.20m falling due within a year, and liabilities of CA$3.92m due beyond that. On the other hand, it had cash of CA$4.59m and CA$2.06m worth of receivables due within a year. So its liabilities total CA$1.47m more than the combination of its cash and short-term receivables.
Of course, Thermal Energy International has a market capitalization of CA$14.4m, so these liabilities are probably manageable. Having said that, it's clear that we should continue to monitor its balance sheet, lest it change for the worse. While it does have liabilities worth noting, Thermal Energy International also has more cash than debt, so we're pretty confident it can manage its debt safely.
Pleasingly, Thermal Energy International is growing its EBIT faster than former Australian PM Bob Hawke downs a yard glass, boasting a 104% gain in the last twelve months. There's no doubt that we learn most about debt from the balance sheet. But you can't view debt in total isolation; since Thermal Energy International will need earnings to service that debt. So when considering debt, it's definitely worth looking at the earnings trend. Click here for an interactive snapshot.
Finally, a company can only pay off debt with cold hard cash, not accounting profits. Thermal Energy International may have net cash on the balance sheet, but it is still interesting to look at how well the business converts its earnings before interest and tax (EBIT) to free cash flow, because that will influence both its need for, and its capacity to manage debt. Happily for any shareholders, Thermal Energy International actually produced more free cash flow than EBIT over the last three years. That sort of strong cash conversion gets us as excited as the crowd when the beat drops at a Daft Punk concert.
Summing up
Although Thermal Energy International's balance sheet isn't particularly strong, due to the total liabilities, it is clearly positive to see that it has net cash of CA$894.8k. The cherry on top was that in converted 220% of that EBIT to free cash flow, bringing in -CA$1.7m. So is Thermal Energy International's debt a risk? It doesn't seem so to us. When analysing debt levels, the balance sheet is the obvious place to start. But ultimately, every company can contain risks that exist outside of the balance sheet. Case in point: We've spotted 3 warning signs for Thermal Energy International you should be aware of, and 1 of them is a bit concerning.
At the end of the day, it's often better to focus on companies that are free from net debt. You can access our special list of such companies (all with a track record of profit growth). It's free.
This article by Simply Wall St is general in nature. It does not constitute a recommendation to buy or sell any stock, and does not take account of your objectives, or your financial situation. We aim to bring you long-term focused analysis driven by fundamental data. Note that our analysis may not factor in the latest price-sensitive company announcements or qualitative material. Simply Wall St has no position in any stocks mentioned.
Have feedback on this article? Concerned about the content? Get in touch with us directly. Alternatively, email editorial-team@simplywallst.com.
