
 Yahoo Finance
 Here’s What We Think About TETRA Technologies, Inc.’s (NYSE:TTI) CEO Pay

Stu Brightman has been the CEO of TETRA Technologies, Inc. (NYSE:TTI) since 2009. This analysis aims first to contrast CEO compensation with other companies that have similar market capitalization. Then we’ll look at a snap shot of the business growth. Third, we’ll reflect on the total return to shareholders over three years, as a second measure of business performance. This method should give us information to assess how appropriately the company pays the CEO.
See our latest analysis for TETRA Technologies
How Does Stu Brightman’s Compensation Compare With Similar Sized Companies?
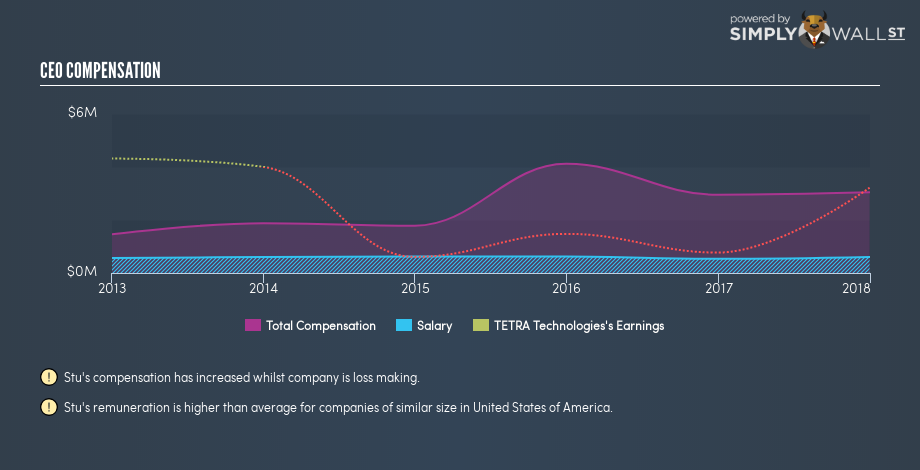
According to our data, TETRA Technologies, Inc. has a market capitalization of US$285m, and pays its CEO total annual compensation worth US$3.0m. (This figure is for the year to 2017). While this analysis focuses on total compensation, it’s worth noting the salary is lower, valued at US$606k. We looked at a group of companies with market capitalizations from US$100m to US$400m, and the median CEO compensation was US$952k.
As you can see, Stu Brightman is paid more than the median CEO pay at companies of a similar size, in the same market. However, this does not necessarily mean TETRA Technologies, Inc. is paying too much. We can better assess whether the pay is overly generous by looking into the underlying business performance.
The graphic below shows how CEO compensation at TETRA Technologies has changed from year to year.
Is TETRA Technologies, Inc. Growing?
TETRA Technologies, Inc. has increased its earnings per share (EPS) by an average of 60% a year, over the last three years (using a line of best fit). Its revenue is up 46% over last year.
This shows that the company has improved itself over the last few years. Good news for shareholders. Most shareholders would be pleased to see strong revenue growth combined with EPS growth. This combo suggests a fast growing business.
You might want to check this free visual report on analyst forecasts for future earnings.
Has TETRA Technologies, Inc. Been A Good Investment?
Given the total loss of 62% over three years, many shareholders in TETRA Technologies, Inc. are probably rather dissatisfied, to say the least. So shareholders would probably think the company shouldn’t be too generous with CEO compensation.
In Summary…
We compared the total CEO remuneration paid by TETRA Technologies, Inc., and compared it to remuneration at a group of similar sized companies. Our data suggests that it pays above the median CEO pay within that group.
Importantly, though, the company has impressed with its earnings per share growth, over three years. However, the returns to investors are far less impressive, over the same period. One might thus conclude that it would be better if the company waited until growth is reflected in the share price, before increasing CEO compensation. Whatever your view on compensation, you might want to check if insiders are buying or selling TETRA Technologies shares (free trial).
Or you could feast your eyes on this interactive graph depicting past earnings, cash flow and revenue.
To help readers see past the short term volatility of the financial market, we aim to bring you a long-term focused research analysis purely driven by fundamental data. Note that our analysis does not factor in the latest price-sensitive company announcements.
The author is an independent contributor and at the time of publication had no position in the stocks mentioned. For errors that warrant correction please contact the editor at editorial-team@simplywallst.com.
