
 Yahoo Finance
 Here’s What We Think About Nicolet Bankshares Inc’s (NASDAQ:NCBS) CEO Pay

Bob Atwell became the CEO of Nicolet Bankshares Inc (NASDAQ:NCBS) in 2000. First, this article will compare CEO compensation with compensation at similar sized companies. Next, we’ll consider growth that the business demonstrates. Third, we’ll reflect on the total return to shareholders over three years, as a second measure of business performance. This process should give us an idea about how appropriately the CEO is paid.
See our latest analysis for Nicolet Bankshares
How Does Bob Atwell’s Compensation Compare With Similar Sized Companies?
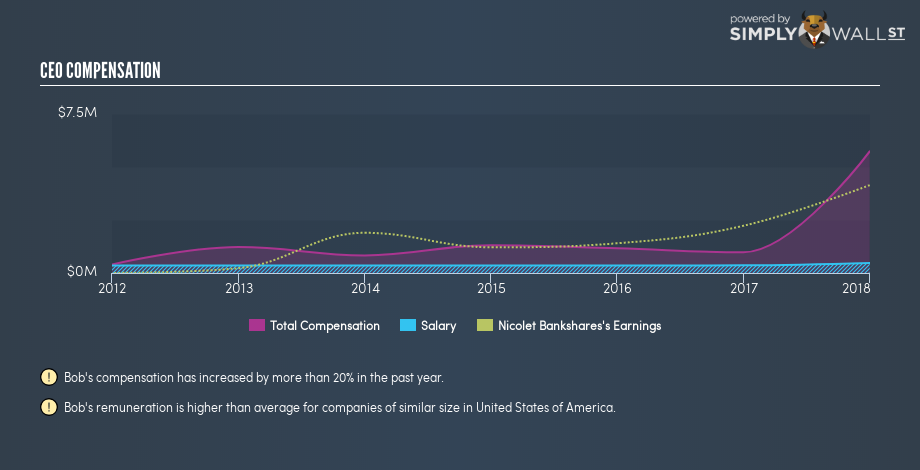
Our data indicates that Nicolet Bankshares Inc is worth US$498m, and total annual CEO compensation is US$5.7m. (This figure is for the year to 2017). We think total compensation is more important but we note that the CEO salary is lower, at US$472k. We looked at a group of companies with market capitalizations from US$200m to US$800m, and the median CEO compensation was US$1.6m.
Thus we can conclude that Bob Atwell receives more in total compensation than the median of a group of companies in the same market, and of similar size to Nicolet Bankshares Inc. However, this doesn’t necessarily mean the pay is too high. We can get a better idea of how generous the pay is by looking at the performance of the underlying business.
You can see a visual representation of the CEO compensation at Nicolet Bankshares, below.
Is Nicolet Bankshares Inc Growing?
Over the last three years Nicolet Bankshares Inc has grown its earnings per share (EPS) by an average of 17% per year. It achieved revenue growth of 15% over the last year.
This shows that the company has improved itself over the last few years. Good news for shareholders. IThis sort of respectable year-on-year revenue growth is often seen at a healthy, growing business.
Shareholders might be interested in this free visualization of analyst forecasts. .
Has Nicolet Bankshares Inc Been A Good Investment?
Most shareholders would probably be pleased with Nicolet Bankshares Inc for providing a total return of 62% over three years. This strong performance might mean some shareholders don’t mind if the CEO is paid more than is normal for a company of its size.
In Summary…
We compared total CEO remuneration at Nicolet Bankshares Inc with the amount paid at companies with a similar market capitalization. Our data suggests that it pays above the median CEO pay within that group.
However, the earnings per share growth over three years is certainly impressive. On top of that, in the same period, returns to shareholders have been great. As a result of this good performance, the CEO remuneration may well be quite reasonable. If you think CEO compensation levels are interesting you will probably really like this free visualization of insider trading at Nicolet Bankshares.
Or you might rather take a peek at this analytical visualization of historic cash flow, earnings and revenue.
To help readers see past the short term volatility of the financial market, we aim to bring you a long-term focused research analysis purely driven by fundamental data. Note that our analysis does not factor in the latest price-sensitive company announcements.
The author is an independent contributor and at the time of publication had no position in the stocks mentioned. For errors that warrant correction please contact the editor at editorial-team@simplywallst.com.
