
 Yahoo Finance
 We Think Majestic Gold (CVE:MJS) Might Have The DNA Of A Multi-Bagger
Finding a business that has the potential to grow substantially is not easy, but it is possible if we look at a few key financial metrics. Firstly, we'll want to see a proven return on capital employed (ROCE) that is increasing, and secondly, an expanding base of capital employed. If you see this, it typically means it's a company with a great business model and plenty of profitable reinvestment opportunities. So when we looked at the ROCE trend of Majestic Gold (CVE:MJS) we really liked what we saw.
Return On Capital Employed (ROCE): What Is It?
If you haven't worked with ROCE before, it measures the 'return' (pre-tax profit) a company generates from capital employed in its business. To calculate this metric for Majestic Gold, this is the formula:
Return on Capital Employed = Earnings Before Interest and Tax (EBIT) ÷ (Total Assets - Current Liabilities)
0.21 = US$23m ÷ (US$135m - US$25m) (Based on the trailing twelve months to March 2022).
So, Majestic Gold has an ROCE of 21%. That's a fantastic return and not only that, it outpaces the average of 2.5% earned by companies in a similar industry.
Check out our latest analysis for Majestic Gold
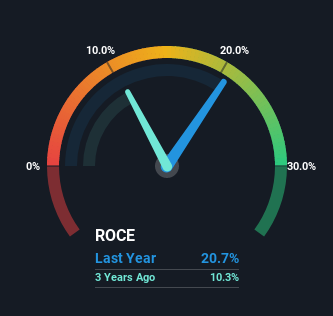
Historical performance is a great place to start when researching a stock so above you can see the gauge for Majestic Gold's ROCE against it's prior returns. If you'd like to look at how Majestic Gold has performed in the past in other metrics, you can view this free graph of past earnings, revenue and cash flow.
What Does the ROCE Trend For Majestic Gold Tell Us?
Majestic Gold is displaying some positive trends. Over the last five years, returns on capital employed have risen substantially to 21%. The company is effectively making more money per dollar of capital used, and it's worth noting that the amount of capital has increased too, by 57%. So we're very much inspired by what we're seeing at Majestic Gold thanks to its ability to profitably reinvest capital.
In another part of our analysis, we noticed that the company's ratio of current liabilities to total assets decreased to 19%, which broadly means the business is relying less on its suppliers or short-term creditors to fund its operations. So shareholders would be pleased that the growth in returns has mostly come from underlying business performance.
The Key Takeaway
A company that is growing its returns on capital and can consistently reinvest in itself is a highly sought after trait, and that's what Majestic Gold has. Astute investors may have an opportunity here because the stock has declined 17% in the last five years. With that in mind, we believe the promising trends warrant this stock for further investigation.
On a final note, we've found 2 warning signs for Majestic Gold that we think you should be aware of.
High returns are a key ingredient to strong performance, so check out our free list ofstocks earning high returns on equity with solid balance sheets.
Have feedback on this article? Concerned about the content? Get in touch with us directly. Alternatively, email editorial-team (at) simplywallst.com.
This article by Simply Wall St is general in nature. We provide commentary based on historical data and analyst forecasts only using an unbiased methodology and our articles are not intended to be financial advice. It does not constitute a recommendation to buy or sell any stock, and does not take account of your objectives, or your financial situation. We aim to bring you long-term focused analysis driven by fundamental data. Note that our analysis may not factor in the latest price-sensitive company announcements or qualitative material. Simply Wall St has no position in any stocks mentioned.
Join A Paid User Research Session
You’ll receive a US$30 Amazon Gift card for 1 hour of your time while helping us build better investing tools for the individual investors like yourself. Sign up here
