
 Yahoo Finance
 We Think Eli Lilly (NYSE:LLY) Can Stay On Top Of Its Debt
Legendary fund manager Li Lu (who Charlie Munger backed) once said, 'The biggest investment risk is not the volatility of prices, but whether you will suffer a permanent loss of capital.' It's only natural to consider a company's balance sheet when you examine how risky it is, since debt is often involved when a business collapses. Importantly, Eli Lilly and Company (NYSE:LLY) does carry debt. But the real question is whether this debt is making the company risky.
When Is Debt A Problem?
Debt assists a business until the business has trouble paying it off, either with new capital or with free cash flow. In the worst case scenario, a company can go bankrupt if it cannot pay its creditors. However, a more usual (but still expensive) situation is where a company must dilute shareholders at a cheap share price simply to get debt under control. Having said that, the most common situation is where a company manages its debt reasonably well - and to its own advantage. When we examine debt levels, we first consider both cash and debt levels, together.
View our latest analysis for Eli Lilly
What Is Eli Lilly's Net Debt?
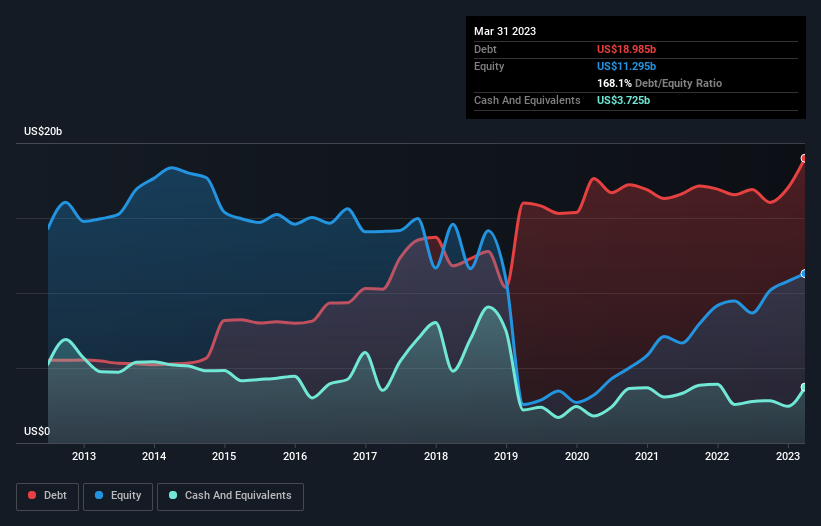
As you can see below, at the end of March 2023, Eli Lilly had US$19.0b of debt, up from US$16.6b a year ago. Click the image for more detail. However, because it has a cash reserve of US$3.72b, its net debt is less, at about US$15.3b.
A Look At Eli Lilly's Liabilities
The latest balance sheet data shows that Eli Lilly had liabilities of US$16.0b due within a year, and liabilities of US$25.9b falling due after that. On the other hand, it had cash of US$3.72b and US$8.90b worth of receivables due within a year. So its liabilities total US$29.2b more than the combination of its cash and short-term receivables.
Since publicly traded Eli Lilly shares are worth a very impressive total of US$423.4b, it seems unlikely that this level of liabilities would be a major threat. Having said that, it's clear that we should continue to monitor its balance sheet, lest it change for the worse.
We measure a company's debt load relative to its earnings power by looking at its net debt divided by its earnings before interest, tax, depreciation, and amortization (EBITDA) and by calculating how easily its earnings before interest and tax (EBIT) cover its interest expense (interest cover). Thus we consider debt relative to earnings both with and without depreciation and amortization expenses.
We'd say that Eli Lilly's moderate net debt to EBITDA ratio ( being 1.7), indicates prudence when it comes to debt. And its strong interest cover of 29.7 times, makes us even more comfortable. But the bad news is that Eli Lilly has seen its EBIT plunge 16% in the last twelve months. We think hat kind of performance, if repeated frequently, could well lead to difficulties for the stock. The balance sheet is clearly the area to focus on when you are analysing debt. But it is future earnings, more than anything, that will determine Eli Lilly's ability to maintain a healthy balance sheet going forward. So if you want to see what the professionals think, you might find this free report on analyst profit forecasts to be interesting.
Finally, while the tax-man may adore accounting profits, lenders only accept cold hard cash. So the logical step is to look at the proportion of that EBIT that is matched by actual free cash flow. Over the most recent three years, Eli Lilly recorded free cash flow worth 63% of its EBIT, which is around normal, given free cash flow excludes interest and tax. This free cash flow puts the company in a good position to pay down debt, when appropriate.
Our View
When it comes to the balance sheet, the standout positive for Eli Lilly was the fact that it seems able to cover its interest expense with its EBIT confidently. However, our other observations weren't so heartening. In particular, EBIT growth rate gives us cold feet. Considering this range of data points, we think Eli Lilly is in a good position to manage its debt levels. Having said that, the load is sufficiently heavy that we would recommend any shareholders keep a close eye on it. The balance sheet is clearly the area to focus on when you are analysing debt. However, not all investment risk resides within the balance sheet - far from it. Be aware that Eli Lilly is showing 2 warning signs in our investment analysis , you should know about...
If you're interested in investing in businesses that can grow profits without the burden of debt, then check out this free list of growing businesses that have net cash on the balance sheet.
Have feedback on this article? Concerned about the content? Get in touch with us directly. Alternatively, email editorial-team (at) simplywallst.com.
This article by Simply Wall St is general in nature. We provide commentary based on historical data and analyst forecasts only using an unbiased methodology and our articles are not intended to be financial advice. It does not constitute a recommendation to buy or sell any stock, and does not take account of your objectives, or your financial situation. We aim to bring you long-term focused analysis driven by fundamental data. Note that our analysis may not factor in the latest price-sensitive company announcements or qualitative material. Simply Wall St has no position in any stocks mentioned.
Join A Paid User Research Session
You’ll receive a US$30 Amazon Gift card for 1 hour of your time while helping us build better investing tools for the individual investors like yourself. Sign up here
