
 Yahoo Finance
 There's Reason For Concern Over Noble Iron Inc.'s (CVE:NIR) Price
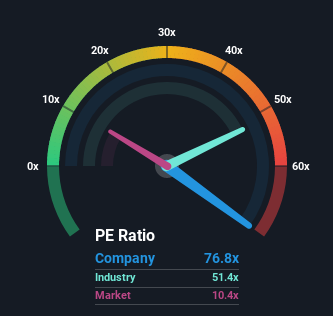
With a price-to-earnings (or "P/E") ratio of 76.8x Noble Iron Inc. (CVE:NIR) may be sending very bearish signals at the moment, given that almost half of all companies in Canada have P/E ratios under 10x and even P/E's lower than 5x are not unusual. Although, it's not wise to just take the P/E at face value as there may be an explanation why it's so lofty.
As an illustration, earnings have deteriorated at Noble Iron over the last year, which is not ideal at all. It might be that many expect the company to still outplay most other companies over the coming period, which has kept the P/E from collapsing. If not, then existing shareholders may be quite nervous about the viability of the share price.
See our latest analysis for Noble Iron
Want the full picture on earnings, revenue and cash flow for the company? Then our free report on Noble Iron will help you shine a light on its historical performance.
How Is Noble Iron's Growth Trending?
The only time you'd be truly comfortable seeing a P/E as steep as Noble Iron's is when the company's growth is on track to outshine the market decidedly.
Taking a look back first, the company's earnings per share growth last year wasn't something to get excited about as it posted a disappointing decline of 19%. Unfortunately, that's brought it right back to where it started three years ago with EPS growth being virtually non-existent overall during that time. Accordingly, shareholders probably wouldn't have been overly satisfied with the unstable medium-term growth rates.
Comparing that to the market, which is predicted to deliver 13% growth in the next 12 months, the company's momentum is weaker based on recent medium-term annualised earnings results.
With this information, we find it concerning that Noble Iron is trading at a P/E higher than the market. Apparently many investors in the company are way more bullish than recent times would indicate and aren't willing to let go of their stock at any price. There's a good chance existing shareholders are setting themselves up for future disappointment if the P/E falls to levels more in line with recent growth rates.
What We Can Learn From Noble Iron's P/E?
Generally, our preference is to limit the use of the price-to-earnings ratio to establishing what the market thinks about the overall health of a company.
We've established that Noble Iron currently trades on a much higher than expected P/E since its recent three-year growth is lower than the wider market forecast. When we see weak earnings with slower than market growth, we suspect the share price is at risk of declining, sending the high P/E lower. If recent medium-term earnings trends continue, it will place shareholders' investments at significant risk and potential investors in danger of paying an excessive premium.
You should always think about risks. Case in point, we've spotted 2 warning signs for Noble Iron you should be aware of, and 1 of them can't be ignored.
You might be able to find a better investment than Noble Iron. If you want a selection of possible candidates, check out this free list of interesting companies that trade on a P/E below 20x (but have proven they can grow earnings).
Have feedback on this article? Concerned about the content? Get in touch with us directly. Alternatively, email editorial-team (at) simplywallst.com.
This article by Simply Wall St is general in nature. We provide commentary based on historical data and analyst forecasts only using an unbiased methodology and our articles are not intended to be financial advice. It does not constitute a recommendation to buy or sell any stock, and does not take account of your objectives, or your financial situation. We aim to bring you long-term focused analysis driven by fundamental data. Note that our analysis may not factor in the latest price-sensitive company announcements or qualitative material. Simply Wall St has no position in any stocks mentioned.
Join A Paid User Research Session
You’ll receive a US$30 Amazon Gift card for 1 hour of your time while helping us build better investing tools for the individual investors like yourself. Sign up here
