
 Yahoo Finance
 There's Been No Shortage Of Growth Recently For Yangarra Resources' (TSE:YGR) Returns On Capital
Did you know there are some financial metrics that can provide clues of a potential multi-bagger? Firstly, we'd want to identify a growing return on capital employed (ROCE) and then alongside that, an ever-increasing base of capital employed. Basically this means that a company has profitable initiatives that it can continue to reinvest in, which is a trait of a compounding machine. With that in mind, we've noticed some promising trends at Yangarra Resources (TSE:YGR) so let's look a bit deeper.
What is Return On Capital Employed (ROCE)?
For those who don't know, ROCE is a measure of a company's yearly pre-tax profit (its return), relative to the capital employed in the business. The formula for this calculation on Yangarra Resources is:
Return on Capital Employed = Earnings Before Interest and Tax (EBIT) ÷ (Total Assets - Current Liabilities)
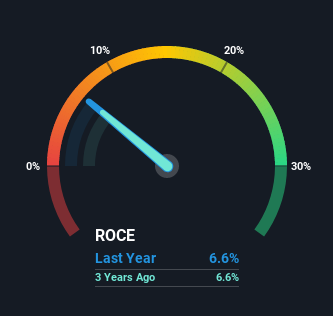
0.066 = CA$40m ÷ (CA$637m - CA$32m) (Based on the trailing twelve months to June 2021).
Therefore, Yangarra Resources has an ROCE of 6.6%. In absolute terms, that's a low return but it's around the Oil and Gas industry average of 5.6%.
Check out our latest analysis for Yangarra Resources
In the above chart we have measured Yangarra Resources' prior ROCE against its prior performance, but the future is arguably more important. If you'd like to see what analysts are forecasting going forward, you should check out our free report for Yangarra Resources.
What Can We Tell From Yangarra Resources' ROCE Trend?
Yangarra Resources has recently broken into profitability so their prior investments seem to be paying off. About five years ago the company was generating losses but things have turned around because it's now earning 6.6% on its capital. Not only that, but the company is utilizing 177% more capital than before, but that's to be expected from a company trying to break into profitability. We like this trend, because it tells us the company has profitable reinvestment opportunities available to it, and if it continues going forward that can lead to a multi-bagger performance.
In another part of our analysis, we noticed that the company's ratio of current liabilities to total assets decreased to 5.0%, which broadly means the business is relying less on its suppliers or short-term creditors to fund its operations. So this improvement in ROCE has come from the business' underlying economics, which is great to see.
The Bottom Line On Yangarra Resources' ROCE
In summary, it's great to see that Yangarra Resources has managed to break into profitability and is continuing to reinvest in its business. Considering the stock has delivered 14% to its stockholders over the last five years, it may be fair to think that investors aren't fully aware of the promising trends yet. Given that, we'd look further into this stock in case it has more traits that could make it multiply in the long term.
One final note, you should learn about the 3 warning signs we've spotted with Yangarra Resources (including 1 which doesn't sit too well with us) .
While Yangarra Resources isn't earning the highest return, check out this free list of companies that are earning high returns on equity with solid balance sheets.
This article by Simply Wall St is general in nature. We provide commentary based on historical data and analyst forecasts only using an unbiased methodology and our articles are not intended to be financial advice. It does not constitute a recommendation to buy or sell any stock, and does not take account of your objectives, or your financial situation. We aim to bring you long-term focused analysis driven by fundamental data. Note that our analysis may not factor in the latest price-sensitive company announcements or qualitative material. Simply Wall St has no position in any stocks mentioned.
Have feedback on this article? Concerned about the content? Get in touch with us directly. Alternatively, email editorial-team (at) simplywallst.com.
