
 Yahoo Finance
 There's Been No Shortage Of Growth Recently For Oil States International's (NYSE:OIS) Returns On Capital
If you're looking for a multi-bagger, there's a few things to keep an eye out for. Typically, we'll want to notice a trend of growing return on capital employed (ROCE) and alongside that, an expanding base of capital employed. If you see this, it typically means it's a company with a great business model and plenty of profitable reinvestment opportunities. So when we looked at Oil States International (NYSE:OIS) and its trend of ROCE, we really liked what we saw.
Return On Capital Employed (ROCE): What Is It?
For those that aren't sure what ROCE is, it measures the amount of pre-tax profits a company can generate from the capital employed in its business. Analysts use this formula to calculate it for Oil States International:
Return on Capital Employed = Earnings Before Interest and Tax (EBIT) ÷ (Total Assets - Current Liabilities)
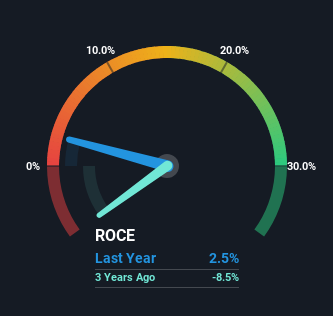
0.025 = US$22m ÷ (US$1.0b - US$157m) (Based on the trailing twelve months to December 2023).
Thus, Oil States International has an ROCE of 2.5%. In absolute terms, that's a low return and it also under-performs the Energy Services industry average of 12%.
Check out our latest analysis for Oil States International
Above you can see how the current ROCE for Oil States International compares to its prior returns on capital, but there's only so much you can tell from the past. If you're interested, you can view the analysts predictions in our free analyst report for Oil States International .
What Does the ROCE Trend For Oil States International Tell Us?
Like most people, we're pleased that Oil States International is now generating some pretax earnings. While the business is profitable now, it used to be incurring losses on invested capital five years ago. Additionally, the business is utilizing 51% less capital than it was five years ago, and taken at face value, that can mean the company needs less funds at work to get a return. The reduction could indicate that the company is selling some assets, and considering returns are up, they appear to be selling the right ones.
In Conclusion...
From what we've seen above, Oil States International has managed to increase it's returns on capital all the while reducing it's capital base. And since the stock has fallen 67% over the last five years, there might be an opportunity here. That being the case, research into the company's current valuation metrics and future prospects seems fitting.
On the other side of ROCE, we have to consider valuation. That's why we have a FREE intrinsic value estimation for OIS on our platform that is definitely worth checking out.
For those who like to invest in solid companies, check out this free list of companies with solid balance sheets and high returns on equity.
Have feedback on this article? Concerned about the content? Get in touch with us directly. Alternatively, email editorial-team (at) simplywallst.com.
This article by Simply Wall St is general in nature. We provide commentary based on historical data and analyst forecasts only using an unbiased methodology and our articles are not intended to be financial advice. It does not constitute a recommendation to buy or sell any stock, and does not take account of your objectives, or your financial situation. We aim to bring you long-term focused analysis driven by fundamental data. Note that our analysis may not factor in the latest price-sensitive company announcements or qualitative material. Simply Wall St has no position in any stocks mentioned.
