
 Yahoo Finance
 There's Been No Shortage Of Growth Recently For Reliance's (NYSE:RS) Returns On Capital
Did you know there are some financial metrics that can provide clues of a potential multi-bagger? Typically, we'll want to notice a trend of growing return on capital employed (ROCE) and alongside that, an expanding base of capital employed. Basically this means that a company has profitable initiatives that it can continue to reinvest in, which is a trait of a compounding machine. So on that note, Reliance (NYSE:RS) looks quite promising in regards to its trends of return on capital.
Understanding Return On Capital Employed (ROCE)
For those who don't know, ROCE is a measure of a company's yearly pre-tax profit (its return), relative to the capital employed in the business. The formula for this calculation on Reliance is:
Return on Capital Employed = Earnings Before Interest and Tax (EBIT) ÷ (Total Assets - Current Liabilities)
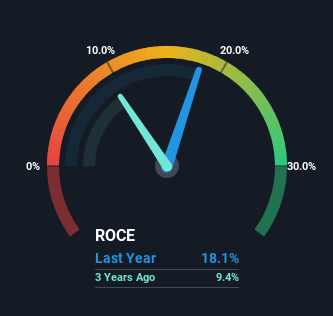
0.18 = US$1.7b ÷ (US$10b - US$844m) (Based on the trailing twelve months to December 2023).
Thus, Reliance has an ROCE of 18%. In absolute terms, that's a satisfactory return, but compared to the Metals and Mining industry average of 10% it's much better.
See our latest analysis for Reliance
In the above chart we have measured Reliance's prior ROCE against its prior performance, but the future is arguably more important. If you're interested, you can view the analysts predictions in our free analyst report for Reliance .
What Does the ROCE Trend For Reliance Tell Us?
We like the trends that we're seeing from Reliance. The data shows that returns on capital have increased substantially over the last five years to 18%. The company is effectively making more money per dollar of capital used, and it's worth noting that the amount of capital has increased too, by 31%. The increasing returns on a growing amount of capital is common amongst multi-baggers and that's why we're impressed.
The Bottom Line
All in all, it's terrific to see that Reliance is reaping the rewards from prior investments and is growing its capital base. Since the stock has returned a staggering 290% to shareholders over the last five years, it looks like investors are recognizing these changes. With that being said, we still think the promising fundamentals mean the company deserves some further due diligence.
If you want to know some of the risks facing Reliance we've found 2 warning signs (1 is potentially serious!) that you should be aware of before investing here.
While Reliance isn't earning the highest return, check out this free list of companies that are earning high returns on equity with solid balance sheets.
Have feedback on this article? Concerned about the content? Get in touch with us directly. Alternatively, email editorial-team (at) simplywallst.com.
This article by Simply Wall St is general in nature. We provide commentary based on historical data and analyst forecasts only using an unbiased methodology and our articles are not intended to be financial advice. It does not constitute a recommendation to buy or sell any stock, and does not take account of your objectives, or your financial situation. We aim to bring you long-term focused analysis driven by fundamental data. Note that our analysis may not factor in the latest price-sensitive company announcements or qualitative material. Simply Wall St has no position in any stocks mentioned.
