
 Yahoo Finance
 There's Been No Shortage Of Growth Recently For DorianG's (NYSE:LPG) Returns On Capital
What trends should we look for it we want to identify stocks that can multiply in value over the long term? Firstly, we'll want to see a proven return on capital employed (ROCE) that is increasing, and secondly, an expanding base of capital employed. Ultimately, this demonstrates that it's a business that is reinvesting profits at increasing rates of return. Speaking of which, we noticed some great changes in DorianG's (NYSE:LPG) returns on capital, so let's have a look.
Understanding Return On Capital Employed (ROCE)
If you haven't worked with ROCE before, it measures the 'return' (pre-tax profit) a company generates from capital employed in its business. To calculate this metric for DorianG, this is the formula:
Return on Capital Employed = Earnings Before Interest and Tax (EBIT) ÷ (Total Assets - Current Liabilities)
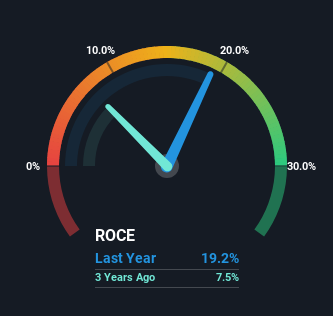
0.19 = US$330m ÷ (US$1.8b - US$102m) (Based on the trailing twelve months to December 2023).
Thus, DorianG has an ROCE of 19%. On its own, that's a standard return, however it's much better than the 15% generated by the Oil and Gas industry.
View our latest analysis for DorianG
In the above chart we have measured DorianG's prior ROCE against its prior performance, but the future is arguably more important. If you'd like, you can check out the forecasts from the analysts covering DorianG for free.
What Can We Tell From DorianG's ROCE Trend?
Shareholders will be relieved that DorianG has broken into profitability. The company now earns 19% on its capital, because five years ago it was incurring losses. On top of that, what's interesting is that the amount of capital being employed has remained steady, so the business hasn't needed to put any additional money to work to generate these higher returns. So while we're happy that the business is more efficient, just keep in mind that could mean that going forward the business is lacking areas to invest internally for growth. After all, a company can only become a long term multi-bagger if it continually reinvests in itself at high rates of return.
Our Take On DorianG's ROCE
In summary, we're delighted to see that DorianG has been able to increase efficiencies and earn higher rates of return on the same amount of capital. And with the stock having performed exceptionally well over the last five years, these patterns are being accounted for by investors. In light of that, we think it's worth looking further into this stock because if DorianG can keep these trends up, it could have a bright future ahead.
One more thing: We've identified 3 warning signs with DorianG (at least 1 which makes us a bit uncomfortable) , and understanding them would certainly be useful.
For those who like to invest in solid companies, check out this free list of companies with solid balance sheets and high returns on equity.
Have feedback on this article? Concerned about the content? Get in touch with us directly. Alternatively, email editorial-team (at) simplywallst.com.
This article by Simply Wall St is general in nature. We provide commentary based on historical data and analyst forecasts only using an unbiased methodology and our articles are not intended to be financial advice. It does not constitute a recommendation to buy or sell any stock, and does not take account of your objectives, or your financial situation. We aim to bring you long-term focused analysis driven by fundamental data. Note that our analysis may not factor in the latest price-sensitive company announcements or qualitative material. Simply Wall St has no position in any stocks mentioned.
