
 Yahoo Finance
 There's No Escaping Tree Island Steel Ltd.'s (TSE:TSL) Muted Earnings
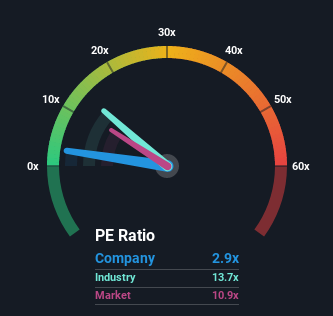
When close to half the companies in Canada have price-to-earnings ratios (or "P/E's") above 11x, you may consider Tree Island Steel Ltd. (TSE:TSL) as a highly attractive investment with its 2.9x P/E ratio. Nonetheless, we'd need to dig a little deeper to determine if there is a rational basis for the highly reduced P/E.
For instance, Tree Island Steel's receding earnings in recent times would have to be some food for thought. One possibility is that the P/E is low because investors think the company won't do enough to avoid underperforming the broader market in the near future. If you like the company, you'd be hoping this isn't the case so that you could potentially pick up some stock while it's out of favour.
View our latest analysis for Tree Island Steel
We don't have analyst forecasts, but you can see how recent trends are setting up the company for the future by checking out our free report on Tree Island Steel's earnings, revenue and cash flow.
How Is Tree Island Steel's Growth Trending?
In order to justify its P/E ratio, Tree Island Steel would need to produce anemic growth that's substantially trailing the market.
If we review the last year of earnings, dishearteningly the company's profits fell to the tune of 62%. At least EPS has managed not to go completely backwards from three years ago in aggregate, thanks to the earlier period of growth. Accordingly, shareholders probably wouldn't have been overly satisfied with the unstable medium-term growth rates.
Weighing that recent medium-term earnings trajectory against the broader market's one-year forecast for expansion of 5.3% shows it's noticeably less attractive on an annualised basis.
With this information, we can see why Tree Island Steel is trading at a P/E lower than the market. Apparently many shareholders weren't comfortable holding on to something they believe will continue to trail the bourse.
The Final Word
Generally, our preference is to limit the use of the price-to-earnings ratio to establishing what the market thinks about the overall health of a company.
As we suspected, our examination of Tree Island Steel revealed its three-year earnings trends are contributing to its low P/E, given they look worse than current market expectations. At this stage investors feel the potential for an improvement in earnings isn't great enough to justify a higher P/E ratio. Unless the recent medium-term conditions improve, they will continue to form a barrier for the share price around these levels.
You should always think about risks. Case in point, we've spotted 4 warning signs for Tree Island Steel you should be aware of, and 2 of them are significant.
If P/E ratios interest you, you may wish to see this free collection of other companies that have grown earnings strongly and trade on P/E's below 20x.
Have feedback on this article? Concerned about the content? Get in touch with us directly. Alternatively, email editorial-team (at) simplywallst.com.
This article by Simply Wall St is general in nature. We provide commentary based on historical data and analyst forecasts only using an unbiased methodology and our articles are not intended to be financial advice. It does not constitute a recommendation to buy or sell any stock, and does not take account of your objectives, or your financial situation. We aim to bring you long-term focused analysis driven by fundamental data. Note that our analysis may not factor in the latest price-sensitive company announcements or qualitative material. Simply Wall St has no position in any stocks mentioned.
Join A Paid User Research Session
You’ll receive a US$30 Amazon Gift card for 1 hour of your time while helping us build better investing tools for the individual investors like yourself. Sign up here
