
 Yahoo Finance
 There's No Escaping FLYHT Aerospace Solutions Ltd.'s (CVE:FLY) Muted Revenues
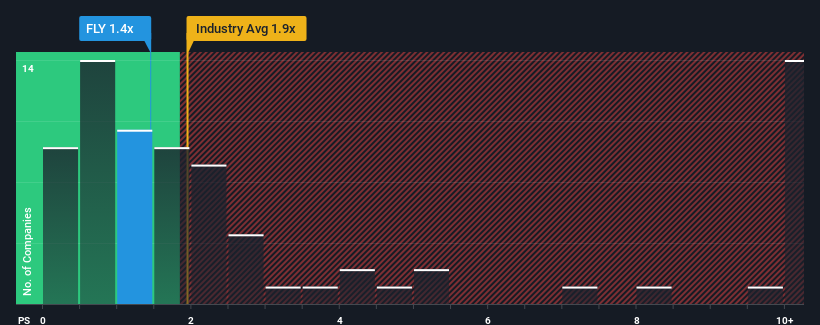
You may think that with a price-to-sales (or "P/S") ratio of 1.4x FLYHT Aerospace Solutions Ltd. (CVE:FLY) is definitely a stock worth checking out, seeing as almost half of all the Aerospace & Defense companies in Canada have P/S ratios greater than 4.8x and even P/S above 15x aren't out of the ordinary. However, the P/S might be quite low for a reason and it requires further investigation to determine if it's justified.
Check out our latest analysis for FLYHT Aerospace Solutions
How Has FLYHT Aerospace Solutions Performed Recently?
FLYHT Aerospace Solutions certainly has been doing a great job lately as it's been growing its revenue at a really rapid pace. Perhaps the market is expecting future revenue performance to dwindle, which has kept the P/S suppressed. If that doesn't eventuate, then existing shareholders have reason to be quite optimistic about the future direction of the share price.
Although there are no analyst estimates available for FLYHT Aerospace Solutions, take a look at this free data-rich visualisation to see how the company stacks up on earnings, revenue and cash flow.
Is There Any Revenue Growth Forecasted For FLYHT Aerospace Solutions?
In order to justify its P/S ratio, FLYHT Aerospace Solutions would need to produce anemic growth that's substantially trailing the industry.
Retrospectively, the last year delivered an exceptional 73% gain to the company's top line. Revenue has also lifted 12% in aggregate from three years ago, mostly thanks to the last 12 months of growth. So we can start by confirming that the company has actually done a good job of growing revenue over that time.
Comparing that to the industry, which is predicted to deliver 11% growth in the next 12 months, the company's momentum is weaker, based on recent medium-term annualised revenue results.
With this in consideration, it's easy to understand why FLYHT Aerospace Solutions' P/S falls short of the mark set by its industry peers. It seems most investors are expecting to see the recent limited growth rates continue into the future and are only willing to pay a reduced amount for the stock.
The Bottom Line On FLYHT Aerospace Solutions' P/S
It's argued the price-to-sales ratio is an inferior measure of value within certain industries, but it can be a powerful business sentiment indicator.
Our examination of FLYHT Aerospace Solutions confirms that the company's revenue trends over the past three-year years are a key factor in its low price-to-sales ratio, as we suspected, given they fall short of current industry expectations. At this stage investors feel the potential for an improvement in revenue isn't great enough to justify a higher P/S ratio. If recent medium-term revenue trends continue, it's hard to see the share price experience a reversal of fortunes anytime soon.
We don't want to rain on the parade too much, but we did also find 2 warning signs for FLYHT Aerospace Solutions (1 doesn't sit too well with us!) that you need to be mindful of.
Of course, profitable companies with a history of great earnings growth are generally safer bets. So you may wish to see this free collection of other companies that have reasonable P/E ratios and have grown earnings strongly.
Have feedback on this article? Concerned about the content? Get in touch with us directly. Alternatively, email editorial-team (at) simplywallst.com.
This article by Simply Wall St is general in nature. We provide commentary based on historical data and analyst forecasts only using an unbiased methodology and our articles are not intended to be financial advice. It does not constitute a recommendation to buy or sell any stock, and does not take account of your objectives, or your financial situation. We aim to bring you long-term focused analysis driven by fundamental data. Note that our analysis may not factor in the latest price-sensitive company announcements or qualitative material. Simply Wall St has no position in any stocks mentioned.
Join A Paid User Research Session
You’ll receive a US$30 Amazon Gift card for 1 hour of your time while helping us build better investing tools for the individual investors like yourself. Sign up here
