
 Yahoo Finance
 TH International Limited (NASDAQ:THCH) Screens Well But There Might Be A Catch
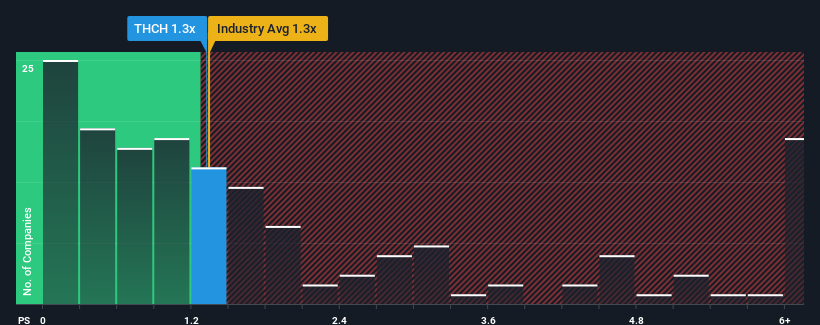
With a median price-to-sales (or "P/S") ratio of close to 1.3x in the Hospitality industry in the United States, you could be forgiven for feeling indifferent about TH International Limited's (NASDAQ:THCH) P/S ratio, which comes in at about the same. However, investors might be overlooking a clear opportunity or potential setback if there is no rational basis for the P/S.
View our latest analysis for TH International
What Does TH International's P/S Mean For Shareholders?
TH International certainly has been doing a great job lately as it's been growing its revenue at a really rapid pace. The P/S is probably moderate because investors think this strong revenue growth might not be enough to outperform the broader industry in the near future. Those who are bullish on TH International will be hoping that this isn't the case, so that they can pick up the stock at a lower valuation.
We don't have analyst forecasts, but you can see how recent trends are setting up the company for the future by checking out our free report on TH International's earnings, revenue and cash flow.
What Are Revenue Growth Metrics Telling Us About The P/S?
In order to justify its P/S ratio, TH International would need to produce growth that's similar to the industry.
Taking a look back first, we see that the company grew revenue by an impressive 59% last year. This great performance means it was also able to deliver immense revenue growth over the last three years. Therefore, it's fair to say the revenue growth recently has been superb for the company.
Comparing that to the industry, which is only predicted to deliver 18% growth in the next 12 months, the company's momentum is stronger based on recent medium-term annualised revenue results.
In light of this, it's curious that TH International's P/S sits in line with the majority of other companies. Apparently some shareholders believe the recent performance is at its limits and have been accepting lower selling prices.
The Final Word
Using the price-to-sales ratio alone to determine if you should sell your stock isn't sensible, however it can be a practical guide to the company's future prospects.
We didn't quite envision TH International's P/S sitting in line with the wider industry, considering the revenue growth over the last three-year is higher than the current industry outlook. When we see strong revenue with faster-than-industry growth, we can only assume potential risks are what might be placing pressure on the P/S ratio. At least the risk of a price drop looks to be subdued if recent medium-term revenue trends continue, but investors seem to think future revenue could see some volatility.
There are also other vital risk factors to consider and we've discovered 4 warning signs for TH International (3 are concerning!) that you should be aware of before investing here.
Of course, profitable companies with a history of great earnings growth are generally safer bets. So you may wish to see this free collection of other companies that have reasonable P/E ratios and have grown earnings strongly.
Have feedback on this article? Concerned about the content? Get in touch with us directly. Alternatively, email editorial-team (at) simplywallst.com.
This article by Simply Wall St is general in nature. We provide commentary based on historical data and analyst forecasts only using an unbiased methodology and our articles are not intended to be financial advice. It does not constitute a recommendation to buy or sell any stock, and does not take account of your objectives, or your financial situation. We aim to bring you long-term focused analysis driven by fundamental data. Note that our analysis may not factor in the latest price-sensitive company announcements or qualitative material. Simply Wall St has no position in any stocks mentioned.
