
 Yahoo Finance
 What Is TFI International's (TSE:TFII) P/E Ratio After Its Share Price Rocketed?

Those holding TFI International (TSE:TFII) shares must be pleased that the share price has rebounded 30% in the last thirty days. But unfortunately, the stock is still down by 8.9% over a quarter. But shareholders may not all be feeling jubilant, since the share price is still down 12% in the last year.
All else being equal, a sharp share price increase should make a stock less attractive to potential investors. While the market sentiment towards a stock is very changeable, in the long run, the share price will tend to move in the same direction as earnings per share. The implication here is that deep value investors might steer clear when expectations of a company are too high. One way to gauge market expectations of a stock is to look at its Price to Earnings Ratio (PE Ratio). A high P/E ratio means that investors have a high expectation about future growth, while a low P/E ratio means they have low expectations about future growth.
Check out our latest analysis for TFI International
Does TFI International Have A Relatively High Or Low P/E For Its Industry?
We can tell from its P/E ratio of 9.59 that sentiment around TFI International isn't particularly high. The image below shows that TFI International has a lower P/E than the average (18.7) P/E for companies in the transportation industry.
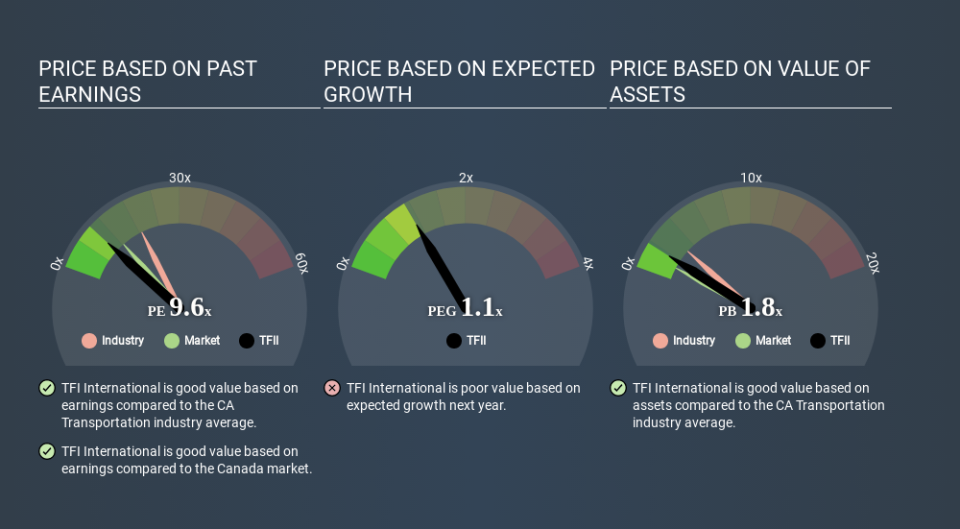
This suggests that market participants think TFI International will underperform other companies in its industry. Since the market seems unimpressed with TFI International, it's quite possible it could surprise on the upside. You should delve deeper. I like to check if company insiders have been buying or selling.
How Growth Rates Impact P/E Ratios
Earnings growth rates have a big influence on P/E ratios. When earnings grow, the 'E' increases, over time. And in that case, the P/E ratio itself will drop rather quickly. And as that P/E ratio drops, the company will look cheap, unless its share price increases.
Most would be impressed by TFI International earnings growth of 13% in the last year. And its annual EPS growth rate over 5 years is 27%. So one might expect an above average P/E ratio.
A Limitation: P/E Ratios Ignore Debt and Cash In The Bank
The 'Price' in P/E reflects the market capitalization of the company. In other words, it does not consider any debt or cash that the company may have on the balance sheet. Hypothetically, a company could reduce its future P/E ratio by spending its cash (or taking on debt) to achieve higher earnings.
While growth expenditure doesn't always pay off, the point is that it is a good option to have; but one that the P/E ratio ignores.
So What Does TFI International's Balance Sheet Tell Us?
Net debt is 42% of TFI International's market cap. You'd want to be aware of this fact, but it doesn't bother us.
The Bottom Line On TFI International's P/E Ratio
TFI International's P/E is 9.6 which is below average (12.3) in the CA market. The company hasn't stretched its balance sheet, and earnings growth was good last year. If it continues to grow, then the current low P/E may prove to be unjustified. What we know for sure is that investors are becoming less uncomfortable about TFI International's prospects, since they have pushed its P/E ratio from 7.4 to 9.6 over the last month. If you like to buy stocks that could be turnaround opportunities, then this one might be a candidate; but if you're more sensitive to price, then you may feel the opportunity has passed.
When the market is wrong about a stock, it gives savvy investors an opportunity. If it is underestimating a company, investors can make money by buying and holding the shares until the market corrects itself. So this free visual report on analyst forecasts could hold the key to an excellent investment decision.
Of course you might be able to find a better stock than TFI International. So you may wish to see this free collection of other companies that have grown earnings strongly.
If you spot an error that warrants correction, please contact the editor at editorial-team@simplywallst.com. This article by Simply Wall St is general in nature. It does not constitute a recommendation to buy or sell any stock, and does not take account of your objectives, or your financial situation. Simply Wall St has no position in the stocks mentioned.
We aim to bring you long-term focused research analysis driven by fundamental data. Note that our analysis may not factor in the latest price-sensitive company announcements or qualitative material. Thank you for reading.
