
 Yahoo Finance
 Is TFI International Inc. (TSE:TFII) A Financially Sound Company?

Want to participate in a short research study? Help shape the future of investing tools and you could win a $250 gift card!
Mid-caps stocks, like TFI International Inc. (TSE:TFII) with a market capitalization of CA$3.2b, aren’t the focus of most investors who prefer to direct their investments towards either large-cap or small-cap stocks. However, history shows that overlooked mid-cap companies have performed better on a risk-adjusted manner than the smaller and larger segment of the market. TFII’s financial liquidity and debt position will be analysed in this article, to get an idea of whether the company can fund opportunities for strategic growth and maintain strength through economic downturns. Note that this commentary is very high-level and solely focused on financial health, so I suggest you dig deeper yourself into TFII here.
View our latest analysis for TFI International
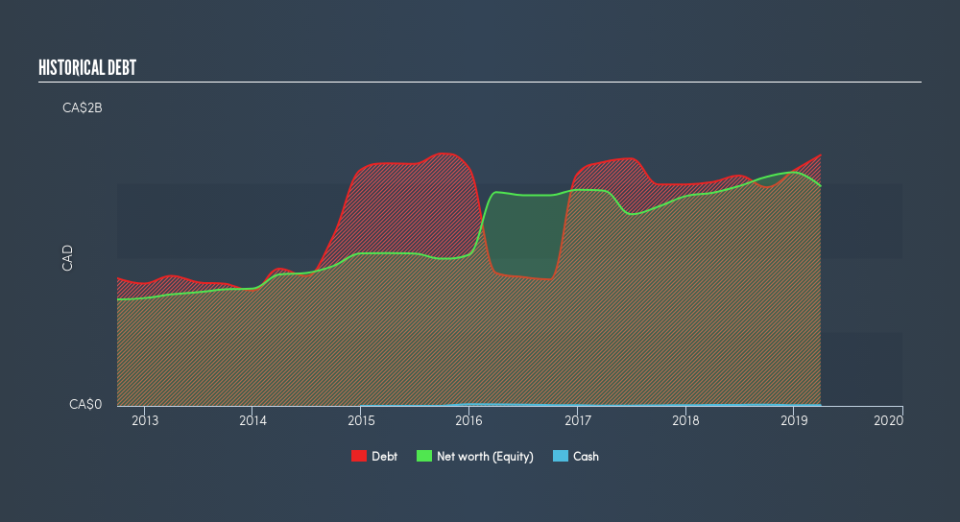
TFII’s Debt (And Cash Flows)
TFII's debt levels surged from CA$1.5b to CA$2.2b over the last 12 months , which includes long-term debt. With this rise in debt, TFII currently has CA$4.4m remaining in cash and short-term investments , ready to be used for running the business. Moreover, TFII has produced CA$646m in operating cash flow in the last twelve months, resulting in an operating cash to total debt ratio of 30%, indicating that TFII’s debt is appropriately covered by operating cash.
Can TFII meet its short-term obligations with the cash in hand?
With current liabilities at CA$648m, it appears that the company has been able to meet these obligations given the level of current assets of CA$708m, with a current ratio of 1.09x. The current ratio is calculated by dividing current assets by current liabilities. Generally, for Transportation companies, this is a reasonable ratio as there's enough of a cash buffer without holding too much capital in low return investments.
Can TFII service its debt comfortably?
With total debt exceeding equity, TFII is considered a highly levered company. This is not uncommon for a mid-cap company given that debt tends to be lower-cost and at times, more accessible. We can check to see whether TFII is able to meet its debt obligations by looking at the net interest coverage ratio. A company generating earnings before interest and tax (EBIT) at least three times its net interest payments is considered financially sound. In TFII's, case, the ratio of 7.79x suggests that interest is appropriately covered, which means that lenders may be inclined to lend more money to the company, as it is seen as safe in terms of payback.
Next Steps:
TFII’s high cash coverage means that, although its debt levels are high, the company is able to utilise its borrowings efficiently in order to generate cash flow. Since there is also no concerns around TFII's liquidity needs, this may be its optimal capital structure for the time being. Keep in mind I haven't considered other factors such as how TFII has been performing in the past. You should continue to research TFI International to get a more holistic view of the mid-cap by looking at:
Future Outlook: What are well-informed industry analysts predicting for TFII’s future growth? Take a look at our free research report of analyst consensus for TFII’s outlook.
Valuation: What is TFII worth today? Is the stock undervalued, even when its growth outlook is factored into its intrinsic value? The intrinsic value infographic in our free research report helps visualize whether TFII is currently mispriced by the market.
Other High-Performing Stocks: Are there other stocks that provide better prospects with proven track records? Explore our free list of these great stocks here.
We aim to bring you long-term focused research analysis driven by fundamental data. Note that our analysis may not factor in the latest price-sensitive company announcements or qualitative material.
If you spot an error that warrants correction, please contact the editor at editorial-team@simplywallst.com. This article by Simply Wall St is general in nature. It does not constitute a recommendation to buy or sell any stock, and does not take account of your objectives, or your financial situation. Simply Wall St has no position in the stocks mentioned. Thank you for reading.
