
 Yahoo Finance
 Textron's (NYSE:TXT) investors will be pleased with their respectable 90% return over the last five years
When we invest, we're generally looking for stocks that outperform the market average. And the truth is, you can make significant gains if you buy good quality businesses at the right price. For example, long term Textron Inc. (NYSE:TXT) shareholders have enjoyed a 89% share price rise over the last half decade, well in excess of the market return of around 74% (not including dividends). However, more recent returns haven't been as impressive as that, with the stock returning just 38% in the last year , including dividends .
Let's take a look at the underlying fundamentals over the longer term, and see if they've been consistent with shareholders returns.
See our latest analysis for Textron
There is no denying that markets are sometimes efficient, but prices do not always reflect underlying business performance. One way to examine how market sentiment has changed over time is to look at the interaction between a company's share price and its earnings per share (EPS).
During five years of share price growth, Textron actually saw its EPS drop 0.4% per year.
By glancing at these numbers, we'd posit that the decline in earnings per share is not representative of how the business has changed over the years. Therefore, it's worth taking a look at other metrics to try to understand the share price movements.
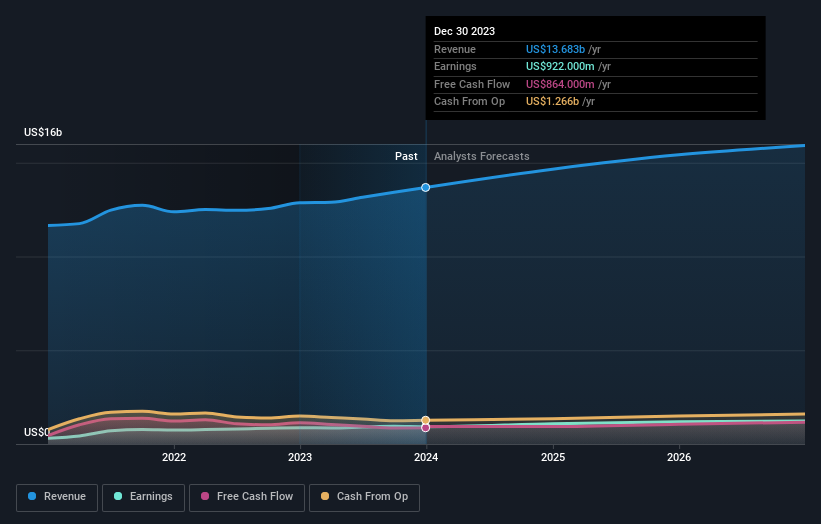
The modest 0.08% dividend yield is unlikely to be propping up the share price. It is not great to see that revenue has dropped by 0.6% per year over five years. It certainly surprises us that the share price is up, but perhaps a closer examination of the data will yield answers.
The image below shows how earnings and revenue have tracked over time (if you click on the image you can see greater detail).
Textron is well known by investors, and plenty of clever analysts have tried to predict the future profit levels. Given we have quite a good number of analyst forecasts, it might be well worth checking out this free chart depicting consensus estimates.
A Different Perspective
It's nice to see that Textron shareholders have received a total shareholder return of 38% over the last year. And that does include the dividend. That gain is better than the annual TSR over five years, which is 14%. Therefore it seems like sentiment around the company has been positive lately. Given the share price momentum remains strong, it might be worth taking a closer look at the stock, lest you miss an opportunity. Before spending more time on Textron it might be wise to click here to see if insiders have been buying or selling shares.
For those who like to find winning investments this free list of growing companies with recent insider purchasing, could be just the ticket.
Please note, the market returns quoted in this article reflect the market weighted average returns of stocks that currently trade on American exchanges.
Have feedback on this article? Concerned about the content? Get in touch with us directly. Alternatively, email editorial-team (at) simplywallst.com.
This article by Simply Wall St is general in nature. We provide commentary based on historical data and analyst forecasts only using an unbiased methodology and our articles are not intended to be financial advice. It does not constitute a recommendation to buy or sell any stock, and does not take account of your objectives, or your financial situation. We aim to bring you long-term focused analysis driven by fundamental data. Note that our analysis may not factor in the latest price-sensitive company announcements or qualitative material. Simply Wall St has no position in any stocks mentioned.
