
 Yahoo Finance
 Terra Firma Capital Corporation (CVE:TII): What Does Its Beta Value Mean For Your Portfolio?

If you’re interested in Terra Firma Capital Corporation (CVE:TII), then you might want to consider its beta (a measure of share price volatility) in order to understand how the stock could impact your portfolio. Modern finance theory considers volatility to be a measure of risk, and there are two main types of price volatility. The first category is company specific volatility. This can be dealt with by limiting your exposure to any particular stock. The second type is the broader market volatility, which you cannot diversify away, since it arises from macroeconomic factors which directly affects all the stocks on the market.
Some stocks are more sensitive to general market forces than others. Beta is a widely used metric to measure a stock’s exposure to market risk (volatility). Before we go on, it’s worth noting that Warren Buffett pointed out in his 2014 letter to shareholders that ‘volatility is far from synonymous with risk.’ Having said that, beta can still be rather useful. The first thing to understand about beta is that the beta of the overall market is one. A stock with a beta below one is either less volatile than the market, or more volatile but not corellated with the overall market. In comparison a stock with a beta of over one tends to be move in a similar direction to the market in the long term, but with greater changes in price.
View our latest analysis for Terra Firma Capital
What TII’s beta value tells investors
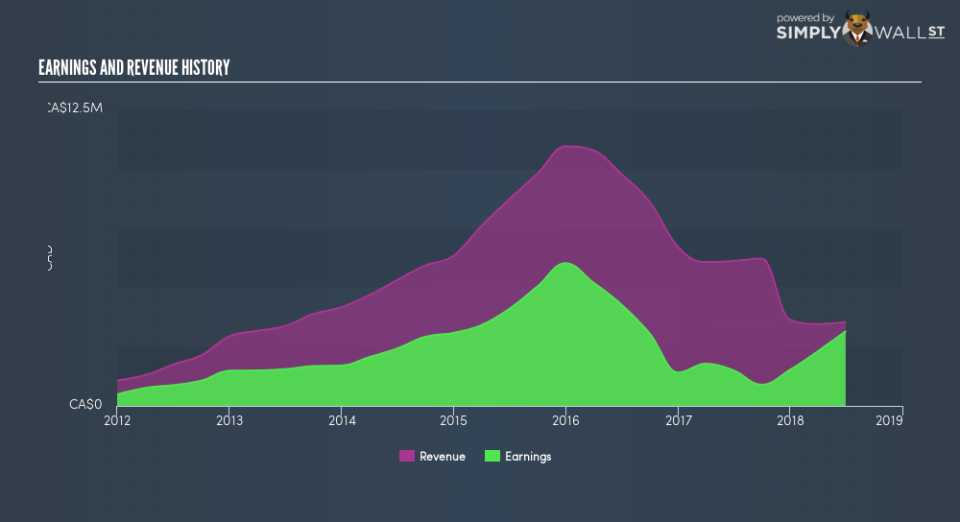
Looking at the last five years, Terra Firma Capital has a beta of 0.91. The fact that this is well below 1 indicates that its share price movements haven’t historically been very sensitive to overall market volatility. This suggests that including it in your portfolio will reduce volatility arising from broader market movements, assuming your portfolio’s weighted average beta is higher than 0.91. Share price volatility is well worth considering, but most long term investors consider the history of revenue and earnings growth to be more important. Take a look at how Terra Firma Capital fares in that regard, below.
Does TII’s size influence the expected beta?
With a market capitalisation of CA$30m, Terra Firma Capital is a very small company by global standards. It is quite likely to be unknown to most investors. It is not unusual for very small companies to have a low beta value, especially if only low volumes of shares are traded. Even when they are traded more actively, the share price is often more susceptible to company specific developments than overall market volatility.
What this means for you:
The Terra Firma Capital doesn’t usually show much sensitivity to the broader market. This could be for a variety of reasons. Typically, smaller companies have a low beta if their share price tends to move a lot due to company specific developments. Alternatively, an strong dividend payer might move less than the market because investors are valuing it for its income stream. This article aims to educate investors about beta values, but it’s well worth looking at important company-specific fundamentals such as Terra Firma Capital’s financial health and performance track record. I urge you to continue your research by taking a look at the following:
Future Outlook: What are well-informed industry analysts predicting for TII’s future growth? Take a look at our free research report of analyst consensus for TII’s outlook.
Past Track Record: Has TII been consistently performing well irrespective of the ups and downs in the market? Go into more detail in the past performance analysis and take a look at the free visual representations of TII’s historicals for more clarity.
Other Interesting Stocks: It’s worth checking to see how TII measures up against other companies on valuation. You could start with this free list of prospective options.
To help readers see past the short term volatility of the financial market, we aim to bring you a long-term focused research analysis purely driven by fundamental data. Note that our analysis does not factor in the latest price-sensitive company announcements.
The author is an independent contributor and at the time of publication had no position in the stocks mentioned. For errors that warrant correction please contact the editor at editorial-team@simplywallst.com.
