
 Yahoo Finance
 Should You Be Tempted To Sell Tenaris SA (BIT:TEN) At Its Current PE Ratio?

The content of this article will benefit those of you who are starting to educate yourself about investing in the stock market and want to start learning about core concepts of fundamental analysis on practical examples from today’s market.
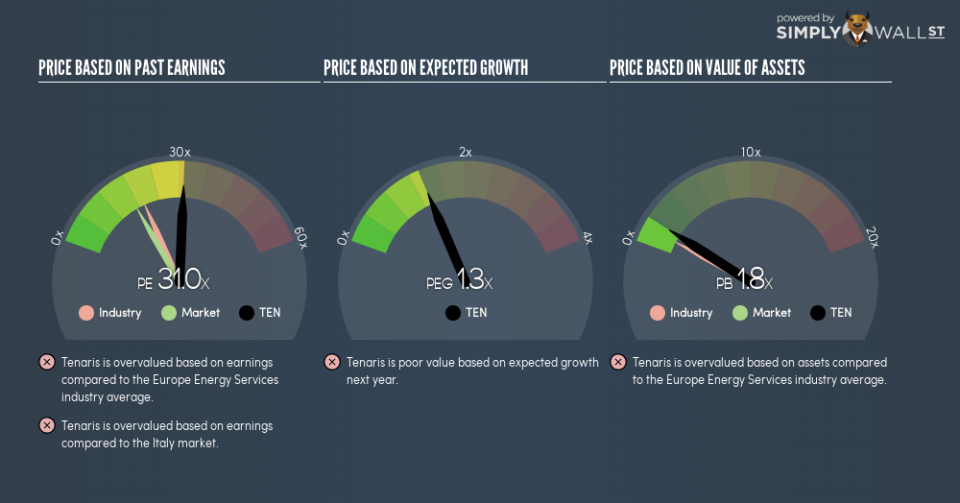
Tenaris SA (BIT:TEN) is currently trading at a trailing P/E of 31, which is higher than the industry average of 19.7. Although some investors may see this as unappealing, it is important to understand the assumptions behind the P/E ratio before making judgments. In this article, I will break down what the P/E ratio is, how to interpret it and what to watch out for.
Check out our latest analysis for Tenaris
Demystifying the P/E ratio
The P/E ratio is a popular ratio used in relative valuation since earnings power is a key driver of investment value. It compares a stock’s price per share to the stock’s earnings per share. A more intuitive way of understanding the P/E ratio is to think of it as how much investors are paying for each dollar of the company’s earnings.
P/E Calculation for TEN
Price-Earnings Ratio = Price per share ÷ Earnings per share
TEN Price-Earnings Ratio = $17.58 ÷ $0.566 = 31x
The P/E ratio itself doesn’t tell you a lot; however, it becomes very insightful when you compare it with other similar companies. We want to compare the stock’s P/E ratio to the average of companies that have similar characteristics as TEN, such as size and country of operation. A common peer group is companies that exist in the same industry, which is what I use. Since TEN’s P/E of 31 is higher than its industry peers (19.7), it means that investors are paying more for each dollar of TEN’s earnings. Since the sector in is relatively small, I’ve included similar companies in the wider region in order to get a better idea of the multiple, which is a median of profitable companies of companies such as , and . You could think of it like this: the market is pricing TEN as if it is a stronger company than the average of its industry group.
Assumptions to be aware of
However, it is important to note that our examination of the stock is based on certain assumptions. Firstly, that our peer group contains companies that are similar to TEN. If this isn’t the case, the difference in P/E could be due to other factors. For example, if Tenaris SA is growing faster than its peers, then it would deserve a higher P/E ratio. Of course, it is possible that the stocks we are comparing with TEN are not fairly valued. Thus while we might conclude that it is richly valued relative to its peers, that could be explained by the peer group being undervalued.
What this means for you:
If your personal research into the stock confirms what the P/E ratio is telling you, it might be a good time to rebalance your portfolio and reduce your holdings in TEN. But keep in mind that the usefulness of relative valuation depends on whether you are comfortable with making the assumptions I mentioned above. Remember that basing your investment decision off one metric alone is certainly not sufficient. There are many things I have not taken into account in this article and the PE ratio is very one-dimensional. If you have not done so already, I urge you to complete your research by taking a look at the following:
Future Outlook: What are well-informed industry analysts predicting for TEN’s future growth? Take a look at our free research report of analyst consensus for TEN’s outlook.
Past Track Record: Has TEN been consistently performing well irrespective of the ups and downs in the market? Go into more detail in the past performance analysis and take a look at the free visual representations of TEN’s historicals for more clarity.
Other High-Performing Stocks: Are there other stocks that provide better prospects with proven track records? Explore our free list of these great stocks here.
To help readers see past the short term volatility of the financial market, we aim to bring you a long-term focused research analysis purely driven by fundamental data. Note that our analysis does not factor in the latest price-sensitive company announcements.
The author is an independent contributor and at the time of publication had no position in the stocks mentioned. For errors that warrant correction please contact the editor at editorial-team@simplywallst.com.
