
 Yahoo Finance
 Should You Be Tempted To Sell Haemonetics Corporation (NYSE:HAE) Because Of Its P/E Ratio?

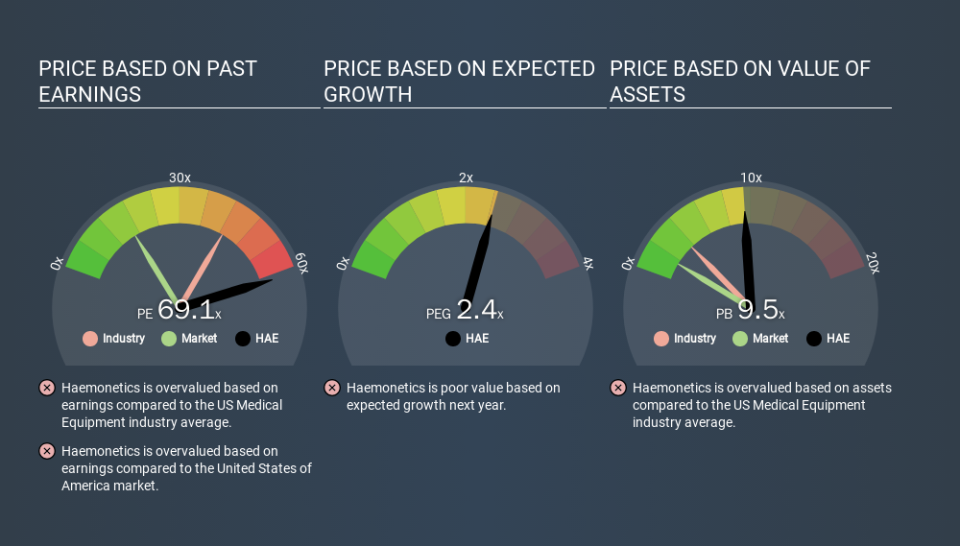
This article is written for those who want to get better at using price to earnings ratios (P/E ratios). We'll show how you can use Haemonetics Corporation's (NYSE:HAE) P/E ratio to inform your assessment of the investment opportunity. What is Haemonetics's P/E ratio? Well, based on the last twelve months it is 69.10. In other words, at today's prices, investors are paying $69.10 for every $1 in prior year profit.
See our latest analysis for Haemonetics
How Do You Calculate A P/E Ratio?
The formula for P/E is:
Price to Earnings Ratio = Share Price ÷ Earnings per Share (EPS)
Or for Haemonetics:
P/E of 69.10 = USD108.33 ÷ USD1.57 (Based on the year to December 2019.)
Is A High P/E Ratio Good?
The higher the P/E ratio, the higher the price tag of a business, relative to its trailing earnings. All else being equal, it's better to pay a low price -- but as Warren Buffett said, 'It's far better to buy a wonderful company at a fair price than a fair company at a wonderful price'.
Does Haemonetics Have A Relatively High Or Low P/E For Its Industry?
We can get an indication of market expectations by looking at the P/E ratio. The image below shows that Haemonetics has a higher P/E than the average (43.0) P/E for companies in the medical equipment industry.
Its relatively high P/E ratio indicates that Haemonetics shareholders think it will perform better than other companies in its industry classification. Shareholders are clearly optimistic, but the future is always uncertain. So investors should delve deeper. I like to check if company insiders have been buying or selling.
How Growth Rates Impact P/E Ratios
P/E ratios primarily reflect market expectations around earnings growth rates. When earnings grow, the 'E' increases, over time. And in that case, the P/E ratio itself will drop rather quickly. Then, a lower P/E should attract more buyers, pushing the share price up.
Haemonetics's earnings made like a rocket, taking off 78% last year. The sweetener is that the annual five year growth rate of 22% is also impressive. With that kind of growth rate we would generally expect a high P/E ratio.
Don't Forget: The P/E Does Not Account For Debt or Bank Deposits
It's important to note that the P/E ratio considers the market capitalization, not the enterprise value. Thus, the metric does not reflect cash or debt held by the company. In theory, a company can lower its future P/E ratio by using cash or debt to invest in growth.
While growth expenditure doesn't always pay off, the point is that it is a good option to have; but one that the P/E ratio ignores.
So What Does Haemonetics's Balance Sheet Tell Us?
Net debt totals just 4.7% of Haemonetics's market cap. So it doesn't have as many options as it would with net cash, but its debt would not have much of an impact on its P/E ratio.
The Bottom Line On Haemonetics's P/E Ratio
With a P/E ratio of 69.1, Haemonetics is expected to grow earnings very strongly in the years to come. The company is not overly constrained by its modest debt levels, and its recent EPS growth is nothing short of stand-out. So to be frank we are not surprised it has a high P/E ratio.
When the market is wrong about a stock, it gives savvy investors an opportunity. As value investor Benjamin Graham famously said, 'In the short run, the market is a voting machine but in the long run, it is a weighing machine. So this free report on the analyst consensus forecasts could help you make a master move on this stock.
Of course, you might find a fantastic investment by looking at a few good candidates. So take a peek at this free list of companies with modest (or no) debt, trading on a P/E below 20.
If you spot an error that warrants correction, please contact the editor at editorial-team@simplywallst.com. This article by Simply Wall St is general in nature. It does not constitute a recommendation to buy or sell any stock, and does not take account of your objectives, or your financial situation. Simply Wall St has no position in the stocks mentioned.
We aim to bring you long-term focused research analysis driven by fundamental data. Note that our analysis may not factor in the latest price-sensitive company announcements or qualitative material. Thank you for reading.
