
 Yahoo Finance
 Should You Be Tempted To Sell GDI Integrated Facility Services Inc. (TSE:GDI) Because Of Its P/E Ratio?

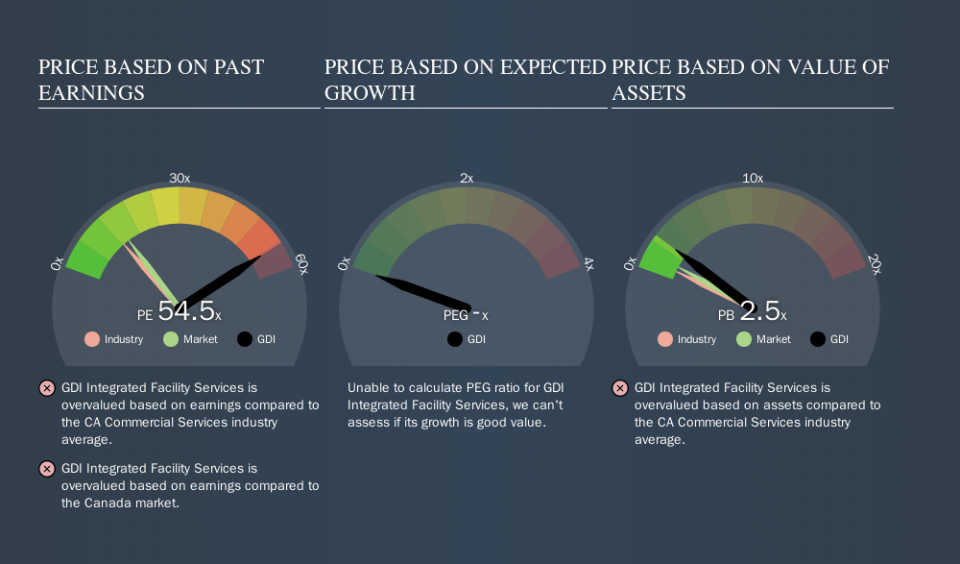
This article is for investors who would like to improve their understanding of price to earnings ratios (P/E ratios). We'll apply a basic P/E ratio analysis to GDI Integrated Facility Services Inc.'s (TSE:GDI), to help you decide if the stock is worth further research. Looking at earnings over the last twelve months, GDI Integrated Facility Services has a P/E ratio of 54.45. In other words, at today's prices, investors are paying CA$54.45 for every CA$1 in prior year profit.
View our latest analysis for GDI Integrated Facility Services
How Do You Calculate A P/E Ratio?
The formula for P/E is:
Price to Earnings Ratio = Share Price ÷ Earnings per Share (EPS)
Or for GDI Integrated Facility Services:
P/E of 54.45 = CA$29.50 ÷ CA$0.54 (Based on the trailing twelve months to June 2019.)
Is A High Price-to-Earnings Ratio Good?
A higher P/E ratio means that buyers have to pay a higher price for each CA$1 the company has earned over the last year. That isn't necessarily good or bad, but a high P/E implies relatively high expectations of what a company can achieve in the future.
How Does GDI Integrated Facility Services's P/E Ratio Compare To Its Peers?
One good way to get a quick read on what market participants expect of a company is to look at its P/E ratio. You can see in the image below that the average P/E (12.5) for companies in the commercial services industry is a lot lower than GDI Integrated Facility Services's P/E.
That means that the market expects GDI Integrated Facility Services will outperform other companies in its industry. The market is optimistic about the future, but that doesn't guarantee future growth. So investors should always consider the P/E ratio alongside other factors, such as whether company directors have been buying shares.
How Growth Rates Impact P/E Ratios
P/E ratios primarily reflect market expectations around earnings growth rates. If earnings are growing quickly, then the 'E' in the equation will increase faster than it would otherwise. Therefore, even if you pay a high multiple of earnings now, that multiple will become lower in the future. So while a stock may look expensive based on past earnings, it could be cheap based on future earnings.
GDI Integrated Facility Services's earnings per share fell by 4.6% in the last twelve months. But it has grown its earnings per share by 3.0% per year over the last three years. And it has shrunk its earnings per share by 24% per year over the last five years. So it would be surprising to see a high P/E.
A Limitation: P/E Ratios Ignore Debt and Cash In The Bank
It's important to note that the P/E ratio considers the market capitalization, not the enterprise value. In other words, it does not consider any debt or cash that the company may have on the balance sheet. In theory, a company can lower its future P/E ratio by using cash or debt to invest in growth.
Such expenditure might be good or bad, in the long term, but the point here is that the balance sheet is not reflected by this ratio.
GDI Integrated Facility Services's Balance Sheet
GDI Integrated Facility Services has net debt equal to 25% of its market cap. While that's enough to warrant consideration, it doesn't really concern us.
The Bottom Line On GDI Integrated Facility Services's P/E Ratio
With a P/E ratio of 54.5, GDI Integrated Facility Services is expected to grow earnings very strongly in the years to come. With a bit of debt, but a lack of recent growth, it's safe to say the market is expecting improved profit performance from the company, in the next few years.
Investors should be looking to buy stocks that the market is wrong about. If the reality for a company is better than it expects, you can make money by buying and holding for the long term. So this free visualization of the analyst consensus on future earnings could help you make the right decision about whether to buy, sell, or hold.
Of course you might be able to find a better stock than GDI Integrated Facility Services. So you may wish to see this free collection of other companies that have grown earnings strongly.
We aim to bring you long-term focused research analysis driven by fundamental data. Note that our analysis may not factor in the latest price-sensitive company announcements or qualitative material.
If you spot an error that warrants correction, please contact the editor at editorial-team@simplywallst.com. This article by Simply Wall St is general in nature. It does not constitute a recommendation to buy or sell any stock, and does not take account of your objectives, or your financial situation. Simply Wall St has no position in the stocks mentioned. Thank you for reading.
