
 Yahoo Finance
 Should You Be Tempted To Sell Canada Goose Holdings Inc (TSE:GOOS) Because Of Its P/E Ratio?

The goal of this article is to teach you how to use price to earnings ratios (P/E ratios). We’ll look at Canada Goose Holdings Inc’s (TSE:GOOS) P/E ratio and reflect on what it tells us about the company’s share price. Canada Goose Holdings has a P/E ratio of 91.29, based on the last twelve months. In other words, at today’s prices, investors are paying CA$91.29 for every CA$1 in prior year profit.
View our latest analysis for Canada Goose Holdings
How Do I Calculate A Price To Earnings Ratio?
The formula for price to earnings is:
Price to Earnings Ratio = Share Price ÷ Earnings per Share (EPS)
Or for Canada Goose Holdings:
P/E of 91.29 = CA$75.76 ÷ CA$0.83 (Based on the trailing twelve months to June 2018.)
Is A High P/E Ratio Good?
A higher P/E ratio means that buyers have to pay a higher price for each CA$1 the company has earned over the last year. All else being equal, it’s better to pay a low price — but as Warren Buffett said, ‘It’s far better to buy a wonderful company at a fair price than a fair company at a wonderful price.’
How Growth Rates Impact P/E Ratios
P/E ratios primarily reflect market expectations around earnings growth rates. Earnings growth means that in the future the ‘E’ will be higher. That means unless the share price increases, the P/E will reduce in a few years. So while a stock may look expensive based on past earnings, it could be cheap based on future earnings.
Canada Goose Holdings increased earnings per share by a whopping 259% last year. And earnings per share have improved by 53% annually, over the last five years. So we’d generally expect it to have a relatively high P/E ratio.
How Does Canada Goose Holdings’s P/E Ratio Compare To Its Peers?
The P/E ratio essentially measures market expectations of a company. The image below shows that Canada Goose Holdings has a significantly higher P/E than the average (21.3) P/E for companies in the luxury industry.
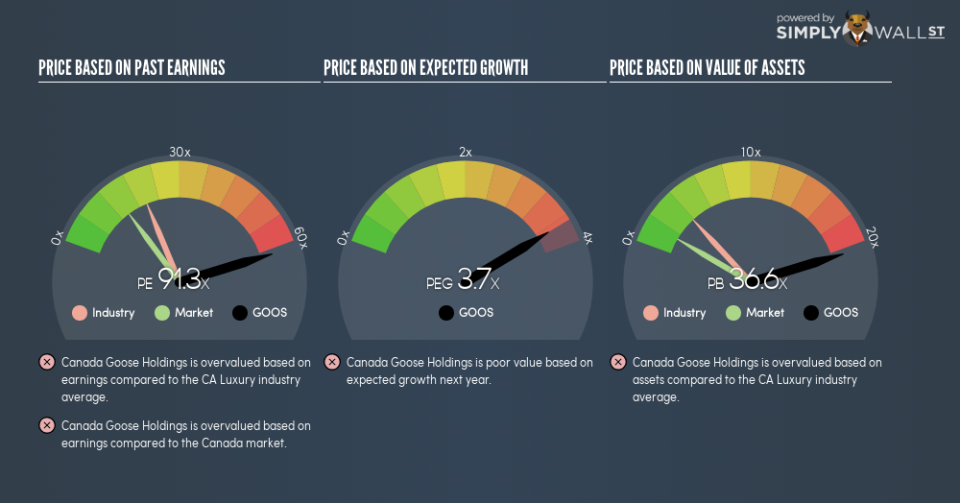
That means that the market expects Canada Goose Holdings will outperform other companies in its industry. Clearly the market expects growth, but it isn’t guaranteed. So investors should always consider the P/E ratio alongside other factors, such as whether company directors have been buying shares.
A Limitation: P/E Ratios Ignore Debt and Cash In The Bank
The ‘Price’ in P/E reflects the market capitalization of the company. Thus, the metric does not reflect cash or debt held by the company. In theory, a company can lower its future P/E ratio by using cash or debt to invest in growth.
Such spending might be good or bad, overall, but the key point here is that you need to look at debt to understand the P/E ratio in context.
How Does Canada Goose Holdings’s Debt Impact Its P/E Ratio?
Canada Goose Holdings has net debt worth just 2.4% of its market capitalization. It would probably trade on a higher P/E ratio if it had a lot of cash, but I doubt it is having a big impact.
The Bottom Line On Canada Goose Holdings’s P/E Ratio
Canada Goose Holdings has a P/E of 91.3. That’s significantly higher than the average in the CA market, which is 14.2. The company is not overly constrained by its modest debt levels, and it is growing earnings per share. So it does not seem strange that the P/E is above average.
When the market is wrong about a stock, it gives savvy investors an opportunity. If the reality for a company is better than it expects, you can make money by buying and holding for the long term. So this free visualization of the analyst consensus on future earnings could help you make the right decision about whether to buy, sell, or hold.
Of course, you might find a fantastic investment by looking at a few good candidates. So take a peek at this free list of companies with modest (or no) debt, trading on a P/E below 20.
To help readers see past the short term volatility of the financial market, we aim to bring you a long-term focused research analysis purely driven by fundamental data. Note that our analysis does not factor in the latest price-sensitive company announcements.
The author is an independent contributor and at the time of publication had no position in the stocks mentioned. For errors that warrant correction please contact the editor at editorial-team@simplywallst.com.
