
 Yahoo Finance
 Should You Be Tempted To Sell Bakkavor Group plc (LON:BAKK) Because Of Its P/E Ratio?

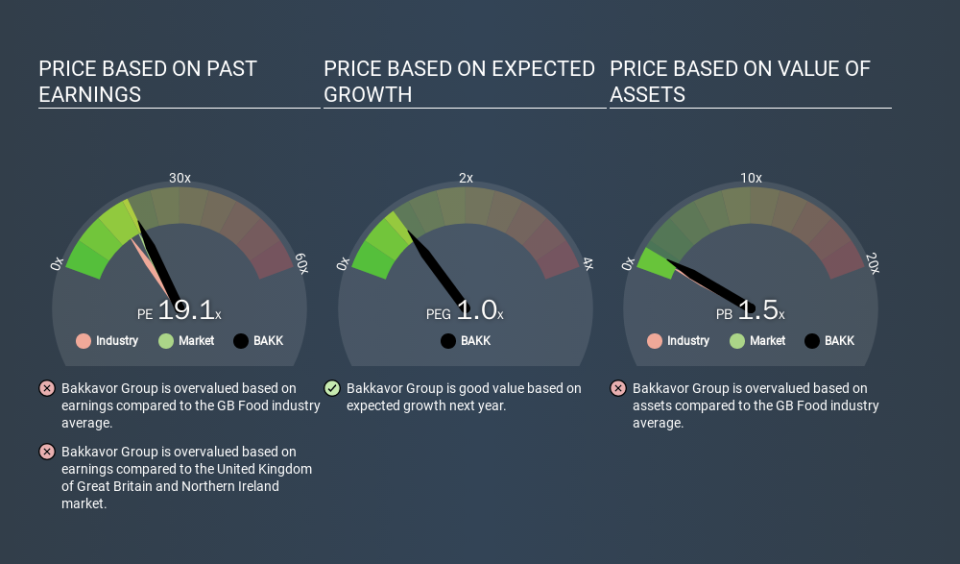
This article is written for those who want to get better at using price to earnings ratios (P/E ratios). We'll show how you can use Bakkavor Group plc's (LON:BAKK) P/E ratio to inform your assessment of the investment opportunity. Looking at earnings over the last twelve months, Bakkavor Group has a P/E ratio of 19.14. In other words, at today's prices, investors are paying £19.14 for every £1 in prior year profit.
See our latest analysis for Bakkavor Group
How Do You Calculate A P/E Ratio?
The formula for price to earnings is:
Price to Earnings Ratio = Share Price ÷ Earnings per Share (EPS)
Or for Bakkavor Group:
P/E of 19.14 = £1.45 ÷ £0.08 (Based on the year to June 2019.)
Is A High P/E Ratio Good?
A higher P/E ratio means that investors are paying a higher price for each £1 of company earnings. That isn't a good or a bad thing on its own, but a high P/E means that buyers have a higher opinion of the business's prospects, relative to stocks with a lower P/E.
How Does Bakkavor Group's P/E Ratio Compare To Its Peers?
We can get an indication of market expectations by looking at the P/E ratio. You can see in the image below that the average P/E (15.3) for companies in the food industry is lower than Bakkavor Group's P/E.
Bakkavor Group's P/E tells us that market participants think the company will perform better than its industry peers, going forward. Clearly the market expects growth, but it isn't guaranteed. So investors should always consider the P/E ratio alongside other factors, such as whether company directors have been buying shares.
How Growth Rates Impact P/E Ratios
Companies that shrink earnings per share quickly will rapidly decrease the 'E' in the equation. Therefore, even if you pay a low multiple of earnings now, that multiple will become higher in the future. A higher P/E should indicate the stock is expensive relative to others -- and that may encourage shareholders to sell.
Bakkavor Group's earnings per share fell by 34% in the last twelve months. And it has shrunk its earnings per share by 1.1% per year over the last five years. This could justify a pessimistic P/E.
A Limitation: P/E Ratios Ignore Debt and Cash In The Bank
One drawback of using a P/E ratio is that it considers market capitalization, but not the balance sheet. That means it doesn't take debt or cash into account. The exact same company would hypothetically deserve a higher P/E ratio if it had a strong balance sheet, than if it had a weak one with lots of debt, because a cashed up company can spend on growth.
Spending on growth might be good or bad a few years later, but the point is that the P/E ratio does not account for the option (or lack thereof).
So What Does Bakkavor Group's Balance Sheet Tell Us?
Bakkavor Group has net debt equal to 41% of its market cap. While that's enough to warrant consideration, it doesn't really concern us.
The Bottom Line On Bakkavor Group's P/E Ratio
Bakkavor Group's P/E is 19.1 which is about average (17.9) in the GB market. Given it has some debt, but didn't grow last year, the P/E indicates the market is expecting higher profits ahead for the business.
Investors should be looking to buy stocks that the market is wrong about. As value investor Benjamin Graham famously said, 'In the short run, the market is a voting machine but in the long run, it is a weighing machine. So this free visualization of the analyst consensus on future earnings could help you make the right decision about whether to buy, sell, or hold.
Of course, you might find a fantastic investment by looking at a few good candidates. So take a peek at this free list of companies with modest (or no) debt, trading on a P/E below 20.
If you spot an error that warrants correction, please contact the editor at editorial-team@simplywallst.com. This article by Simply Wall St is general in nature. It does not constitute a recommendation to buy or sell any stock, and does not take account of your objectives, or your financial situation. Simply Wall St has no position in the stocks mentioned.
We aim to bring you long-term focused research analysis driven by fundamental data. Note that our analysis may not factor in the latest price-sensitive company announcements or qualitative material. Thank you for reading.