
 Yahoo Finance
 Tecsys Inc. (TSE:TCS) Stock Is Going Strong But Fundamentals Look Uncertain: What Lies Ahead ?
Most readers would already be aware that Tecsys' (TSE:TCS) stock increased significantly by 11% over the past three months. However, we decided to pay attention to the company's fundamentals which don't appear to give a clear sign about the company's financial health. In this article, we decided to focus on Tecsys' ROE.
Return on Equity or ROE is a test of how effectively a company is growing its value and managing investors’ money. In simpler terms, it measures the profitability of a company in relation to shareholder's equity.
See our latest analysis for Tecsys
How Do You Calculate Return On Equity?
ROE can be calculated by using the formula:
Return on Equity = Net Profit (from continuing operations) ÷ Shareholders' Equity
So, based on the above formula, the ROE for Tecsys is:
2.8% = CA$2.0m ÷ CA$72m (Based on the trailing twelve months to January 2024).
The 'return' is the yearly profit. That means that for every CA$1 worth of shareholders' equity, the company generated CA$0.03 in profit.
What Is The Relationship Between ROE And Earnings Growth?
We have already established that ROE serves as an efficient profit-generating gauge for a company's future earnings. Based on how much of its profits the company chooses to reinvest or "retain", we are then able to evaluate a company's future ability to generate profits. Generally speaking, other things being equal, firms with a high return on equity and profit retention, have a higher growth rate than firms that don’t share these attributes.
Tecsys' Earnings Growth And 2.8% ROE
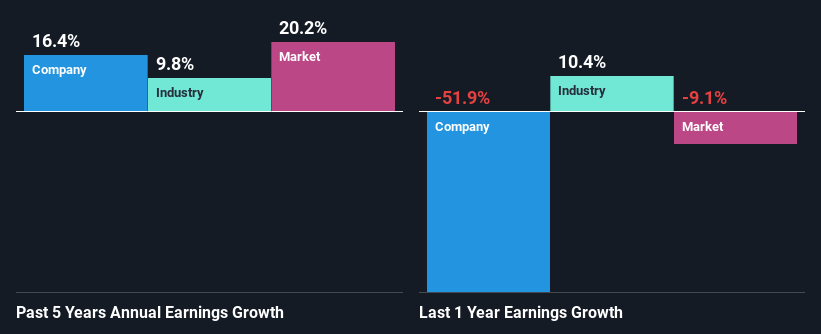
As you can see, Tecsys' ROE looks pretty weak. Even when compared to the industry average of 9.7%, the ROE figure is pretty disappointing. However, the moderate 16% net income growth seen by Tecsys over the past five years is definitely a positive. We believe that there might be other aspects that are positively influencing the company's earnings growth. Such as - high earnings retention or an efficient management in place.
As a next step, we compared Tecsys' net income growth with the industry, and pleasingly, we found that the growth seen by the company is higher than the average industry growth of 9.8%.
Earnings growth is a huge factor in stock valuation. What investors need to determine next is if the expected earnings growth, or the lack of it, is already built into the share price. By doing so, they will have an idea if the stock is headed into clear blue waters or if swampy waters await. One good indicator of expected earnings growth is the P/E ratio which determines the price the market is willing to pay for a stock based on its earnings prospects. So, you may want to check if Tecsys is trading on a high P/E or a low P/E, relative to its industry.
Is Tecsys Efficiently Re-investing Its Profits?
The high three-year median payout ratio of 95% (or a retention ratio of 4.7%) for Tecsys suggests that the company's growth wasn't really hampered despite it returning most of its income to its shareholders.
Additionally, Tecsys has paid dividends over a period of at least ten years which means that the company is pretty serious about sharing its profits with shareholders.
Summary
On the whole, we feel that the performance shown by Tecsys can be open to many interpretations. While no doubt its earnings growth is pretty substantial, its ROE and earnings retention is quite poor. So while the company has managed to grow its earnings in spite of this, we are unconvinced if this growth could extend, especially during troubled times. So far, we've only made a quick discussion around the company's earnings growth. So it may be worth checking this free detailed graph of Tecsys' past earnings, as well as revenue and cash flows to get a deeper insight into the company's performance.
Have feedback on this article? Concerned about the content? Get in touch with us directly. Alternatively, email editorial-team (at) simplywallst.com.
This article by Simply Wall St is general in nature. We provide commentary based on historical data and analyst forecasts only using an unbiased methodology and our articles are not intended to be financial advice. It does not constitute a recommendation to buy or sell any stock, and does not take account of your objectives, or your financial situation. We aim to bring you long-term focused analysis driven by fundamental data. Note that our analysis may not factor in the latest price-sensitive company announcements or qualitative material. Simply Wall St has no position in any stocks mentioned.
