
 Yahoo Finance
 Is TECSYS Inc.’s (TSE:TCS) Balance Sheet A Threat To Its Future?

Investors are always looking for growth in small-cap stocks like TECSYS Inc. (TSE:TCS), with a market cap of CA$182m. However, an important fact which most ignore is: how financially healthy is the business? Assessing first and foremost the financial health is crucial, as mismanagement of capital can lead to bankruptcies, which occur at a higher rate for small-caps. We’ll look at some basic checks that can form a snapshot the company’s financial strength. Nevertheless, these checks don’t give you a full picture, so I suggest you dig deeper yourself into TCS here.
Does TCS Produce Much Cash Relative To Its Debt?
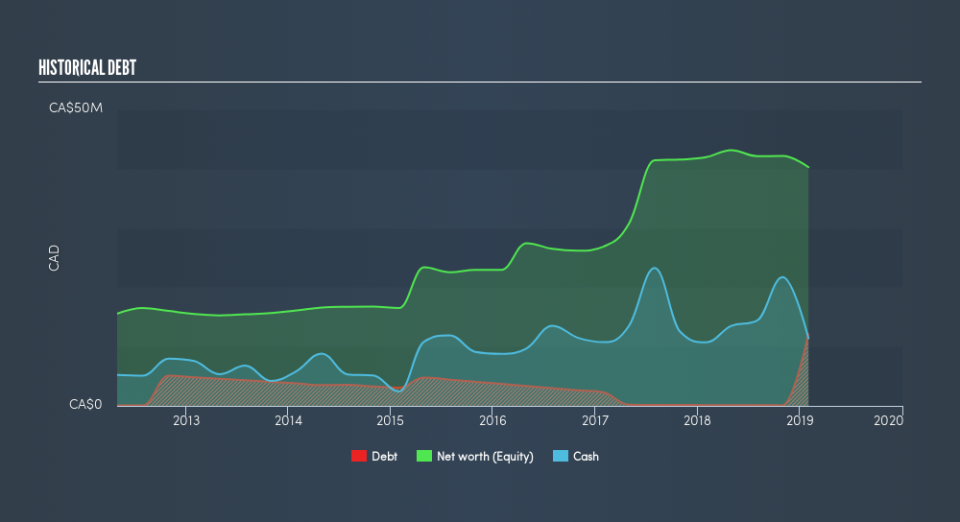
Over the past year, TCS has ramped up its debt from CA$135k to CA$12m – this includes long-term debt. With this growth in debt, the current cash and short-term investment levels stands at CA$11m , ready to be used for running the business. Moreover, TCS has generated cash from operations of CA$4.1m during the same period of time, resulting in an operating cash to total debt ratio of 34%, indicating that TCS’s debt is appropriately covered by operating cash.
Does TCS’s liquid assets cover its short-term commitments?
Looking at TCS’s CA$27m in current liabilities, it seems that the business has been able to meet these commitments with a current assets level of CA$49m, leading to a 1.83x current account ratio. The current ratio is calculated by dividing current assets by current liabilities. For Software companies, this ratio is within a sensible range as there’s enough of a cash buffer without holding too much capital in low return investments.
Is TCS’s debt level acceptable?
With a debt-to-equity ratio of 30%, TCS’s debt level may be seen as prudent. This range is considered safe as TCS is not taking on too much debt obligation, which can be restrictive and risky for equity-holders.
Next Steps:
TCS has demonstrated its ability to generate sufficient levels of cash flow, while its debt hovers at an appropriate level. In addition to this, the company will be able to pay all of its upcoming liabilities from its current short-term assets. This is only a rough assessment of financial health, and I’m sure TCS has company-specific issues impacting its capital structure decisions. You should continue to research TECSYS to get a better picture of the stock by looking at:
Future Outlook: What are well-informed industry analysts predicting for TCS’s future growth? Take a look at our free research report of analyst consensus for TCS’s outlook.
Valuation: What is TCS worth today? Is the stock undervalued, even when its growth outlook is factored into its intrinsic value? The intrinsic value infographic in our free research report helps visualize whether TCS is currently mispriced by the market.
Other High-Performing Stocks: Are there other stocks that provide better prospects with proven track records? Explore our free list of these great stocks here.
We aim to bring you long-term focused research analysis driven by fundamental data. Note that our analysis may not factor in the latest price-sensitive company announcements or qualitative material.
If you spot an error that warrants correction, please contact the editor at editorial-team@simplywallst.com. This article by Simply Wall St is general in nature. It does not constitute a recommendation to buy or sell any stock, and does not take account of your objectives, or your financial situation. Simply Wall St has no position in the stocks mentioned. Thank you for reading.
