
 Yahoo Finance
 TC Energy (TSE:TRP) Hasn't Managed To Accelerate Its Returns
Finding a business that has the potential to grow substantially is not easy, but it is possible if we look at a few key financial metrics. Amongst other things, we'll want to see two things; firstly, a growing return on capital employed (ROCE) and secondly, an expansion in the company's amount of capital employed. Put simply, these types of businesses are compounding machines, meaning they are continually reinvesting their earnings at ever-higher rates of return. Although, when we looked at TC Energy (TSE:TRP), it didn't seem to tick all of these boxes.
Return On Capital Employed (ROCE): What Is It?
Just to clarify if you're unsure, ROCE is a metric for evaluating how much pre-tax income (in percentage terms) a company earns on the capital invested in its business. To calculate this metric for TC Energy, this is the formula:
Return on Capital Employed = Earnings Before Interest and Tax (EBIT) ÷ (Total Assets - Current Liabilities)
0.06 = CA$6.8b ÷ (CA$125b - CA$12b) (Based on the trailing twelve months to December 2023).
Thus, TC Energy has an ROCE of 6.0%. Ultimately, that's a low return and it under-performs the Oil and Gas industry average of 9.0%.
Check out our latest analysis for TC Energy
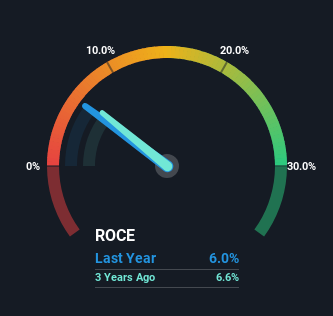
Above you can see how the current ROCE for TC Energy compares to its prior returns on capital, but there's only so much you can tell from the past. If you'd like to see what analysts are forecasting going forward, you should check out our free analyst report for TC Energy .
The Trend Of ROCE
There are better returns on capital out there than what we're seeing at TC Energy. The company has employed 32% more capital in the last five years, and the returns on that capital have remained stable at 6.0%. This poor ROCE doesn't inspire confidence right now, and with the increase in capital employed, it's evident that the business isn't deploying the funds into high return investments.
In Conclusion...
In summary, TC Energy has simply been reinvesting capital and generating the same low rate of return as before. Unsurprisingly, the stock has only gained 2.2% over the last five years, which potentially indicates that investors are accounting for this going forward. So if you're looking for a multi-bagger, the underlying trends indicate you may have better chances elsewhere.
If you want to know some of the risks facing TC Energy we've found 3 warning signs (2 shouldn't be ignored!) that you should be aware of before investing here.
While TC Energy isn't earning the highest return, check out this free list of companies that are earning high returns on equity with solid balance sheets.
Have feedback on this article? Concerned about the content? Get in touch with us directly. Alternatively, email editorial-team (at) simplywallst.com.
This article by Simply Wall St is general in nature. We provide commentary based on historical data and analyst forecasts only using an unbiased methodology and our articles are not intended to be financial advice. It does not constitute a recommendation to buy or sell any stock, and does not take account of your objectives, or your financial situation. We aim to bring you long-term focused analysis driven by fundamental data. Note that our analysis may not factor in the latest price-sensitive company announcements or qualitative material. Simply Wall St has no position in any stocks mentioned.
