
 Yahoo Finance
 Taiga Building Products (TSE:TBL) shareholders have earned a 25% CAGR over the last five years
When you buy shares in a company, it's worth keeping in mind the possibility that it could fail, and you could lose your money. But on the bright side, if you buy shares in a high quality company at the right price, you can gain well over 100%. For instance, the price of Taiga Building Products Ltd. (TSE:TBL) stock is up an impressive 157% over the last five years. We note the stock price is up 1.8% in the last seven days.
Let's take a look at the underlying fundamentals over the longer term, and see if they've been consistent with shareholders returns.
View our latest analysis for Taiga Building Products
To paraphrase Benjamin Graham: Over the short term the market is a voting machine, but over the long term it's a weighing machine. One way to examine how market sentiment has changed over time is to look at the interaction between a company's share price and its earnings per share (EPS).
During five years of share price growth, Taiga Building Products achieved compound earnings per share (EPS) growth of 76% per year. This EPS growth is higher than the 21% average annual increase in the share price. Therefore, it seems the market has become relatively pessimistic about the company. This cautious sentiment is reflected in its (fairly low) P/E ratio of 5.08.
The image below shows how EPS has tracked over time (if you click on the image you can see greater detail).
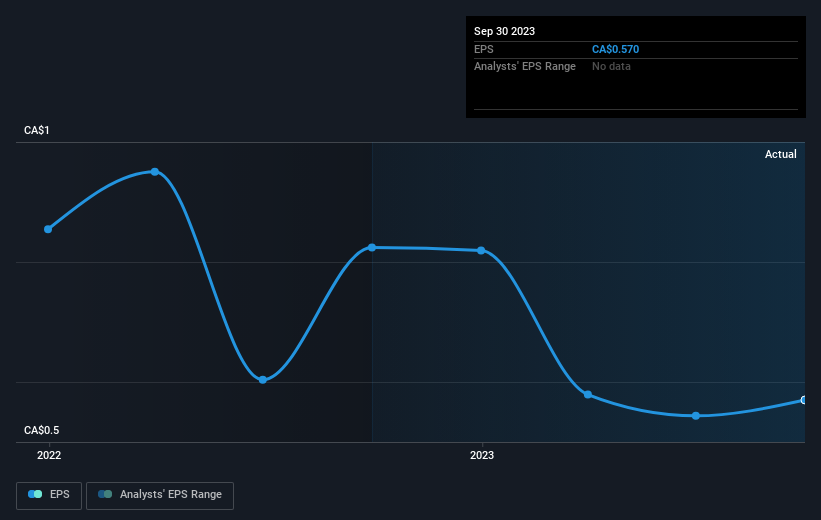
Dive deeper into Taiga Building Products' key metrics by checking this interactive graph of Taiga Building Products's earnings, revenue and cash flow.
What About The Total Shareholder Return (TSR)?
We'd be remiss not to mention the difference between Taiga Building Products' total shareholder return (TSR) and its share price return. The TSR attempts to capture the value of dividends (as if they were reinvested) as well as any spin-offs or discounted capital raisings offered to shareholders. Dividends have been really beneficial for Taiga Building Products shareholders, and that cash payout contributed to why its TSR of 203%, over the last 5 years, is better than the share price return.
A Different Perspective
Taiga Building Products provided a TSR of 1.2% over the last twelve months. But that return falls short of the market. On the bright side, the longer term returns (running at about 25% a year, over half a decade) look better. It's quite possible the business continues to execute with prowess, even as the share price gains are slowing. Is Taiga Building Products cheap compared to other companies? These 3 valuation measures might help you decide.
Of course Taiga Building Products may not be the best stock to buy. So you may wish to see this free collection of growth stocks.
Please note, the market returns quoted in this article reflect the market weighted average returns of stocks that currently trade on Canadian exchanges.
Have feedback on this article? Concerned about the content? Get in touch with us directly. Alternatively, email editorial-team (at) simplywallst.com.
This article by Simply Wall St is general in nature. We provide commentary based on historical data and analyst forecasts only using an unbiased methodology and our articles are not intended to be financial advice. It does not constitute a recommendation to buy or sell any stock, and does not take account of your objectives, or your financial situation. We aim to bring you long-term focused analysis driven by fundamental data. Note that our analysis may not factor in the latest price-sensitive company announcements or qualitative material. Simply Wall St has no position in any stocks mentioned.
