
 Yahoo Finance
 Sysco (NYSE:SYY) shareholders have earned a 13% CAGR over the last five years
If you buy and hold a stock for many years, you'd hope to be making a profit. Better yet, you'd like to see the share price move up more than the market average. Unfortunately for shareholders, while the Sysco Corporation (NYSE:SYY) share price is up 66% in the last five years, that's less than the market return. Zooming in, the stock is up a respectable 6.7% in the last year.
So let's assess the underlying fundamentals over the last 5 years and see if they've moved in lock-step with shareholder returns.
See our latest analysis for Sysco
While markets are a powerful pricing mechanism, share prices reflect investor sentiment, not just underlying business performance. One way to examine how market sentiment has changed over time is to look at the interaction between a company's share price and its earnings per share (EPS).
During five years of share price growth, Sysco achieved compound earnings per share (EPS) growth of 4.9% per year. This EPS growth is lower than the 11% average annual increase in the share price. So it's fair to assume the market has a higher opinion of the business than it did five years ago. That's not necessarily surprising considering the five-year track record of earnings growth.
The company's earnings per share (over time) is depicted in the image below (click to see the exact numbers).
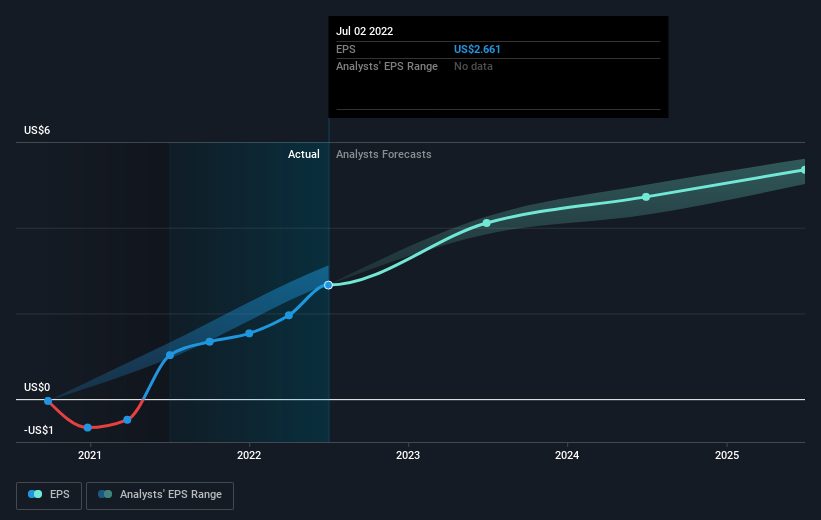
We know that Sysco has improved its bottom line lately, but is it going to grow revenue? You could check out this free report showing analyst revenue forecasts.
What About Dividends?
It is important to consider the total shareholder return, as well as the share price return, for any given stock. Whereas the share price return only reflects the change in the share price, the TSR includes the value of dividends (assuming they were reinvested) and the benefit of any discounted capital raising or spin-off. Arguably, the TSR gives a more comprehensive picture of the return generated by a stock. As it happens, Sysco's TSR for the last 5 years was 87%, which exceeds the share price return mentioned earlier. The dividends paid by the company have thusly boosted the total shareholder return.
A Different Perspective
We're pleased to report that Sysco shareholders have received a total shareholder return of 9.2% over one year. That's including the dividend. However, the TSR over five years, coming in at 13% per year, is even more impressive. The pessimistic view would be that be that the stock has its best days behind it, but on the other hand the price might simply be moderating while the business itself continues to execute. While it is well worth considering the different impacts that market conditions can have on the share price, there are other factors that are even more important. Even so, be aware that Sysco is showing 2 warning signs in our investment analysis , and 1 of those is a bit unpleasant...
If you would prefer to check out another company -- one with potentially superior financials -- then do not miss this free list of companies that have proven they can grow earnings.
Please note, the market returns quoted in this article reflect the market weighted average returns of stocks that currently trade on US exchanges.
Have feedback on this article? Concerned about the content? Get in touch with us directly. Alternatively, email editorial-team (at) simplywallst.com.
This article by Simply Wall St is general in nature. We provide commentary based on historical data and analyst forecasts only using an unbiased methodology and our articles are not intended to be financial advice. It does not constitute a recommendation to buy or sell any stock, and does not take account of your objectives, or your financial situation. We aim to bring you long-term focused analysis driven by fundamental data. Note that our analysis may not factor in the latest price-sensitive company announcements or qualitative material. Simply Wall St has no position in any stocks mentioned.
Join A Paid User Research Session
You’ll receive a US$30 Amazon Gift card for 1 hour of your time while helping us build better investing tools for the individual investors like yourself. Sign up here
