
 Yahoo Finance
 Is The Swatch Group AG's (VTX:UHR) Recent Price Movement Underpinned By Its Weak Fundamentals?
Swatch Group (VTX:UHR) has had a rough three months with its share price down 11%. It seems that the market might have completely ignored the positive aspects of the company's fundamentals and decided to weigh-in more on the negative aspects. Long-term fundamentals are usually what drive market outcomes, so it's worth paying close attention. In this article, we decided to focus on Swatch Group's ROE.
ROE or return on equity is a useful tool to assess how effectively a company can generate returns on the investment it received from its shareholders. In short, ROE shows the profit each dollar generates with respect to its shareholder investments.
See our latest analysis for Swatch Group
How Is ROE Calculated?
ROE can be calculated by using the formula:
Return on Equity = Net Profit (from continuing operations) ÷ Shareholders' Equity
So, based on the above formula, the ROE for Swatch Group is:
7.0% = CHF824m ÷ CHF12b (Based on the trailing twelve months to June 2022).
The 'return' is the yearly profit. So, this means that for every CHF1 of its shareholder's investments, the company generates a profit of CHF0.07.
What Is The Relationship Between ROE And Earnings Growth?
We have already established that ROE serves as an efficient profit-generating gauge for a company's future earnings. Depending on how much of these profits the company reinvests or "retains", and how effectively it does so, we are then able to assess a company’s earnings growth potential. Assuming all else is equal, companies that have both a higher return on equity and higher profit retention are usually the ones that have a higher growth rate when compared to companies that don't have the same features.
A Side By Side comparison of Swatch Group's Earnings Growth And 7.0% ROE
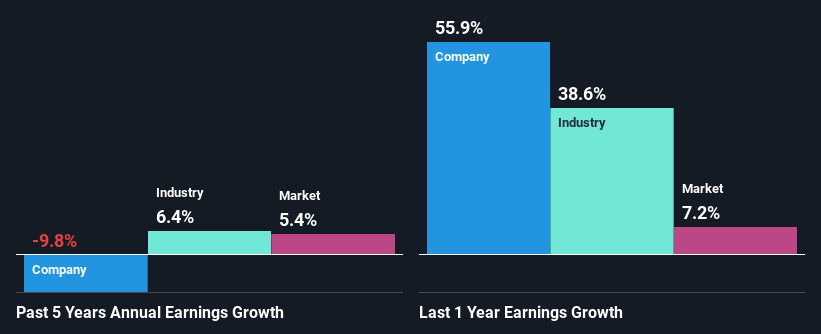
At first glance, Swatch Group's ROE doesn't look very promising. We then compared the company's ROE to the broader industry and were disappointed to see that the ROE is lower than the industry average of 18%. Therefore, it might not be wrong to say that the five year net income decline of 9.8% seen by Swatch Group was probably the result of it having a lower ROE. However, there could also be other factors causing the earnings to decline. For example, it is possible that the business has allocated capital poorly or that the company has a very high payout ratio.
However, when we compared Swatch Group's growth with the industry we found that while the company's earnings have been shrinking, the industry has seen an earnings growth of 11% in the same period. This is quite worrisome.
Earnings growth is an important metric to consider when valuing a stock. It’s important for an investor to know whether the market has priced in the company's expected earnings growth (or decline). By doing so, they will have an idea if the stock is headed into clear blue waters or if swampy waters await. Has the market priced in the future outlook for UHR? You can find out in our latest intrinsic value infographic research report.
Is Swatch Group Making Efficient Use Of Its Profits?
Despite having a normal three-year median payout ratio of 38% (where it is retaining 62% of its profits), Swatch Group has seen a decline in earnings as we saw above. So there could be some other explanations in that regard. For instance, the company's business may be deteriorating.
Moreover, Swatch Group has been paying dividends for at least ten years or more suggesting that management must have perceived that the shareholders prefer dividends over earnings growth. Our latest analyst data shows that the future payout ratio of the company is expected to rise to 49% over the next three years. However, the company's ROE is not expected to change by much despite the higher expected payout ratio.
Summary
In total, we're a bit ambivalent about Swatch Group's performance. While the company does have a high rate of profit retention, its low rate of return is probably hampering its earnings growth. That being so, the latest industry analyst forecasts show that the analysts are expecting to see a huge improvement in the company's earnings growth rate. To know more about the company's future earnings growth forecasts take a look at this free report on analyst forecasts for the company to find out more.
Have feedback on this article? Concerned about the content? Get in touch with us directly. Alternatively, email editorial-team (at) simplywallst.com.
This article by Simply Wall St is general in nature. We provide commentary based on historical data and analyst forecasts only using an unbiased methodology and our articles are not intended to be financial advice. It does not constitute a recommendation to buy or sell any stock, and does not take account of your objectives, or your financial situation. We aim to bring you long-term focused analysis driven by fundamental data. Note that our analysis may not factor in the latest price-sensitive company announcements or qualitative material. Simply Wall St has no position in any stocks mentioned.
Join A Paid User Research Session
You’ll receive a US$30 Amazon Gift card for 1 hour of your time while helping us build better investing tools for the individual investors like yourself. Sign up here
