
 Yahoo Finance
 Sureserve Group's (LON:SUR) investors will be pleased with their impressive 221% return over the last three years
The worst result, after buying shares in a company (assuming no leverage), would be if you lose all the money you put in. But if you buy shares in a really great company, you can more than double your money. To wit, the Sureserve Group plc (LON:SUR) share price has flown 213% in the last three years. That sort of return is as solid as granite.
So let's assess the underlying fundamentals over the last 3 years and see if they've moved in lock-step with shareholder returns.
View our latest analysis for Sureserve Group
There is no denying that markets are sometimes efficient, but prices do not always reflect underlying business performance. By comparing earnings per share (EPS) and share price changes over time, we can get a feel for how investor attitudes to a company have morphed over time.
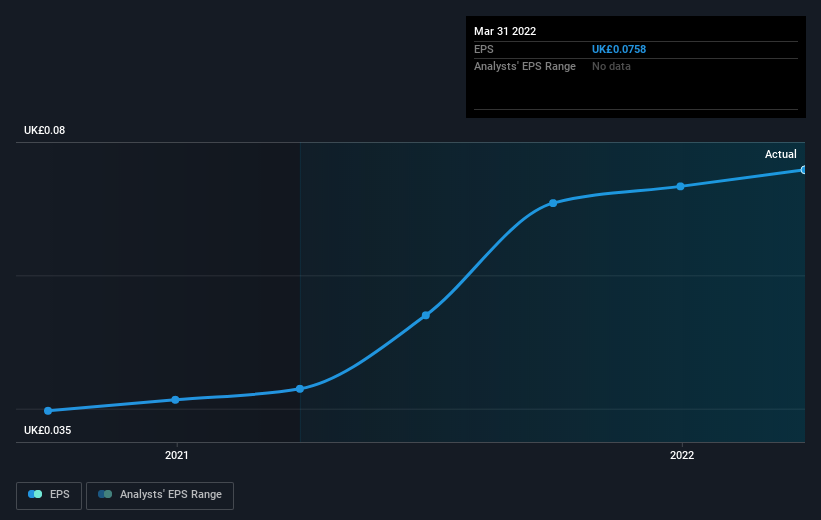
Sureserve Group was able to grow its EPS at 70% per year over three years, sending the share price higher. This EPS growth is higher than the 46% average annual increase in the share price. So it seems investors have become more cautious about the company, over time. We'd venture the lowish P/E ratio of 11.39 also reflects the negative sentiment around the stock.
You can see below how EPS has changed over time (discover the exact values by clicking on the image).
We like that insiders have been buying shares in the last twelve months. Even so, future earnings will be far more important to whether current shareholders make money. This free interactive report on Sureserve Group's earnings, revenue and cash flow is a great place to start, if you want to investigate the stock further.
What about the Total Shareholder Return (TSR)?
We'd be remiss not to mention the difference between Sureserve Group's total shareholder return (TSR) and its share price return. The TSR attempts to capture the value of dividends (as if they were reinvested) as well as any spin-offs or discounted capital raisings offered to shareholders. Dividends have been really beneficial for Sureserve Group shareholders, and that cash payout contributed to why its TSR of 221%, over the last 3 years, is better than the share price return.
A Different Perspective
Investors in Sureserve Group had a tough year, with a total loss of 1.2%, against a market gain of about 1.1%. However, keep in mind that even the best stocks will sometimes underperform the market over a twelve month period. Longer term investors wouldn't be so upset, since they would have made 13%, each year, over five years. It could be that the recent sell-off is an opportunity, so it may be worth checking the fundamental data for signs of a long term growth trend. It's always interesting to track share price performance over the longer term. But to understand Sureserve Group better, we need to consider many other factors. Case in point: We've spotted 1 warning sign for Sureserve Group you should be aware of.
There are plenty of other companies that have insiders buying up shares. You probably do not want to miss this free list of growing companies that insiders are buying.
Please note, the market returns quoted in this article reflect the market weighted average returns of stocks that currently trade on GB exchanges.
Have feedback on this article? Concerned about the content? Get in touch with us directly. Alternatively, email editorial-team (at) simplywallst.com.
This article by Simply Wall St is general in nature. We provide commentary based on historical data and analyst forecasts only using an unbiased methodology and our articles are not intended to be financial advice. It does not constitute a recommendation to buy or sell any stock, and does not take account of your objectives, or your financial situation. We aim to bring you long-term focused analysis driven by fundamental data. Note that our analysis may not factor in the latest price-sensitive company announcements or qualitative material. Simply Wall St has no position in any stocks mentioned.
