
 Yahoo Finance
 It's A Story Of Risk Vs Reward With Best World International Limited (SGX:CGN)
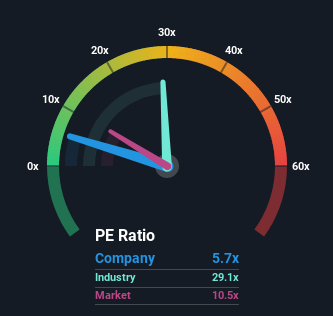
With a price-to-earnings (or "P/E") ratio of 5.7x Best World International Limited (SGX:CGN) may be sending bullish signals at the moment, given that almost half of all companies in Singapore have P/E ratios greater than 11x and even P/E's higher than 18x are not unusual. Although, it's not wise to just take the P/E at face value as there may be an explanation why it's limited.
As an illustration, earnings have deteriorated at Best World International over the last year, which is not ideal at all. It might be that many expect the disappointing earnings performance to continue or accelerate, which has repressed the P/E. However, if this doesn't eventuate then existing shareholders may be feeling optimistic about the future direction of the share price.
View our latest analysis for Best World International
Want the full picture on earnings, revenue and cash flow for the company? Then our free report on Best World International will help you shine a light on its historical performance.
Is There Any Growth For Best World International?
Best World International's P/E ratio would be typical for a company that's only expected to deliver limited growth, and importantly, perform worse than the market.
Retrospectively, the last year delivered a frustrating 8.9% decrease to the company's bottom line. However, a few very strong years before that means that it was still able to grow EPS by an impressive 115% in total over the last three years. So we can start by confirming that the company has generally done a very good job of growing earnings over that time, even though it had some hiccups along the way.
In contrast to the company, the rest of the market is expected to decline by 1.0% over the next year, which puts the company's recent medium-term positive growth rates in a good light for now.
In light of this, it's quite peculiar that Best World International's P/E sits below the majority of other companies. Apparently some shareholders believe the recent performance has exceeded its limits and have been accepting significantly lower selling prices.
The Bottom Line On Best World International's P/E
Typically, we'd caution against reading too much into price-to-earnings ratios when settling on investment decisions, though it can reveal plenty about what other market participants think about the company.
We've established that Best World International currently trades on a much lower than expected P/E since its recent three-year earnings growth is beating forecasts for a struggling market. There could be some major unobserved threats to earnings preventing the P/E ratio from matching this positive performance. One major risk is whether its earnings trajectory can keep outperforming under these tough market conditions. It appears many are indeed anticipating earnings instability, because this relative performance should normally provide a boost to the share price.
You always need to take note of risks, for example - Best World International has 2 warning signs we think you should be aware of.
If P/E ratios interest you, you may wish to see this free collection of other companies that have grown earnings strongly and trade on P/E's below 20x.
Have feedback on this article? Concerned about the content? Get in touch with us directly. Alternatively, email editorial-team (at) simplywallst.com.
This article by Simply Wall St is general in nature. We provide commentary based on historical data and analyst forecasts only using an unbiased methodology and our articles are not intended to be financial advice. It does not constitute a recommendation to buy or sell any stock, and does not take account of your objectives, or your financial situation. We aim to bring you long-term focused analysis driven by fundamental data. Note that our analysis may not factor in the latest price-sensitive company announcements or qualitative material. Simply Wall St has no position in any stocks mentioned.
Join A Paid User Research Session
You’ll receive a US$30 Amazon Gift card for 1 hour of your time while helping us build better investing tools for the individual investors like yourself. Sign up here
