
 Yahoo Finance
 Stella-Jones Inc. (TSE:SJ) Stock Has Shown Weakness Lately But Financials Look Strong: Should Prospective Shareholders Make The Leap?
With its stock down 8.9% over the past month, it is easy to disregard Stella-Jones (TSE:SJ). But if you pay close attention, you might gather that its strong financials could mean that the stock could potentially see an increase in value in the long-term, given how markets usually reward companies with good financial health. Specifically, we decided to study Stella-Jones' ROE in this article.
Return on equity or ROE is a key measure used to assess how efficiently a company's management is utilizing the company's capital. In other words, it is a profitability ratio which measures the rate of return on the capital provided by the company's shareholders.
Check out our latest analysis for Stella-Jones
How Do You Calculate Return On Equity?
The formula for return on equity is:
Return on Equity = Net Profit (from continuing operations) ÷ Shareholders' Equity
So, based on the above formula, the ROE for Stella-Jones is:
16% = CA$239m ÷ CA$1.5b (Based on the trailing twelve months to September 2021).
The 'return' is the yearly profit. Another way to think of that is that for every CA$1 worth of equity, the company was able to earn CA$0.16 in profit.
What Is The Relationship Between ROE And Earnings Growth?
So far, we've learned that ROE is a measure of a company's profitability. Based on how much of its profits the company chooses to reinvest or "retain", we are then able to evaluate a company's future ability to generate profits. Assuming everything else remains unchanged, the higher the ROE and profit retention, the higher the growth rate of a company compared to companies that don't necessarily bear these characteristics.
Stella-Jones' Earnings Growth And 16% ROE
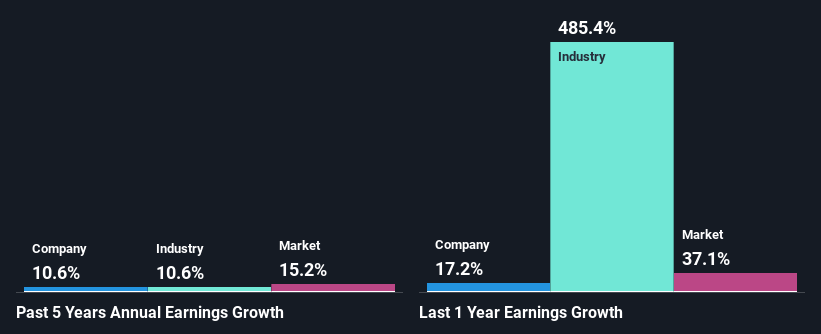
To begin with, Stella-Jones seems to have a respectable ROE. Yet, the fact that the company's ROE is lower than the industry average of 28% does temper our expectations. Although, we can see that Stella-Jones saw a modest net income growth of 11% over the past five years. We reckon that there could be other factors at play here. For example, it is possible that the company's management has made some good strategic decisions, or that the company has a low payout ratio. Bear in mind, the company does have a respectable level of ROE. It is just that the industry ROE is higher. So this also provides some context to the earnings growth seen by the company.
We then performed a comparison between Stella-Jones' net income growth with the industry, which revealed that the company's growth is similar to the average industry growth of 11% in the same period.
Earnings growth is an important metric to consider when valuing a stock. It’s important for an investor to know whether the market has priced in the company's expected earnings growth (or decline). Doing so will help them establish if the stock's future looks promising or ominous. Has the market priced in the future outlook for SJ? You can find out in our latest intrinsic value infographic research report.
Is Stella-Jones Using Its Retained Earnings Effectively?
In Stella-Jones' case, its respectable earnings growth can probably be explained by its low three-year median payout ratio of 22% (or a retention ratio of 78%), which suggests that the company is investing most of its profits to grow its business.
Additionally, Stella-Jones has paid dividends over a period of at least ten years which means that the company is pretty serious about sharing its profits with shareholders. Upon studying the latest analysts' consensus data, we found that the company is expected to keep paying out approximately 24% of its profits over the next three years. As a result, Stella-Jones' ROE is not expected to change by much either, which we inferred from the analyst estimate of 13% for future ROE.
Conclusion
In total, we are pretty happy with Stella-Jones' performance. Particularly, we like that the company is reinvesting heavily into its business at a moderate rate of return. Unsurprisingly, this has led to an impressive earnings growth. Having said that, on studying current analyst estimates, we were concerned to see that while the company has grown its earnings in the past, analysts expect its earnings to shrink in the future. To know more about the latest analysts predictions for the company, check out this visualization of analyst forecasts for the company.
This article by Simply Wall St is general in nature. We provide commentary based on historical data and analyst forecasts only using an unbiased methodology and our articles are not intended to be financial advice. It does not constitute a recommendation to buy or sell any stock, and does not take account of your objectives, or your financial situation. We aim to bring you long-term focused analysis driven by fundamental data. Note that our analysis may not factor in the latest price-sensitive company announcements or qualitative material. Simply Wall St has no position in any stocks mentioned.
Have feedback on this article? Concerned about the content? Get in touch with us directly. Alternatively, email editorial-team (at) simplywallst.com.
