
 Yahoo Finance
 Stantec (TSE:STN) sheds 6.4% this week, as yearly returns fall more in line with earnings growth
Stantec Inc. (TSE:STN) shareholders might be concerned after seeing the share price drop 10% in the last quarter. Looking further back, the stock has generated good profits over five years. After all, the share price is up a market-beating 79% in that time.
While the stock has fallen 6.4% this week, it's worth focusing on the longer term and seeing if the stocks historical returns have been driven by the underlying fundamentals.
Check out our latest analysis for Stantec
While the efficient markets hypothesis continues to be taught by some, it has been proven that markets are over-reactive dynamic systems, and investors are not always rational. One flawed but reasonable way to assess how sentiment around a company has changed is to compare the earnings per share (EPS) with the share price.
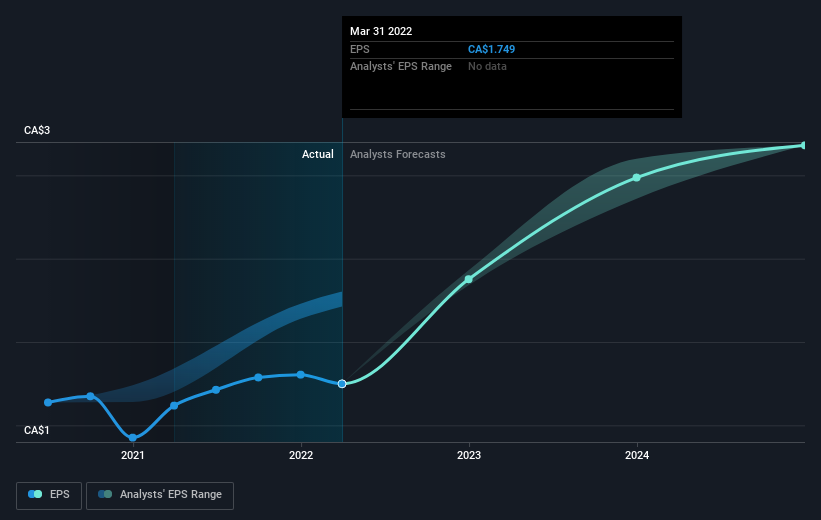
During five years of share price growth, Stantec achieved compound earnings per share (EPS) growth of 36% per year. The EPS growth is more impressive than the yearly share price gain of 12% over the same period. So one could conclude that the broader market has become more cautious towards the stock.
You can see how EPS has changed over time in the image below (click on the chart to see the exact values).
We like that insiders have been buying shares in the last twelve months. Having said that, most people consider earnings and revenue growth trends to be a more meaningful guide to the business. Before buying or selling a stock, we always recommend a close examination of historic growth trends, available here..
What About Dividends?
It is important to consider the total shareholder return, as well as the share price return, for any given stock. The TSR is a return calculation that accounts for the value of cash dividends (assuming that any dividend received was reinvested) and the calculated value of any discounted capital raisings and spin-offs. Arguably, the TSR gives a more comprehensive picture of the return generated by a stock. We note that for Stantec the TSR over the last 5 years was 94%, which is better than the share price return mentioned above. And there's no prize for guessing that the dividend payments largely explain the divergence!
A Different Perspective
Stantec shareholders are up 4.0% for the year (even including dividends). But that return falls short of the market. On the bright side, the longer term returns (running at about 14% a year, over half a decade) look better. It's quite possible the business continues to execute with prowess, even as the share price gains are slowing. It's always interesting to track share price performance over the longer term. But to understand Stantec better, we need to consider many other factors. For instance, we've identified 1 warning sign for Stantec that you should be aware of.
Stantec is not the only stock insiders are buying. So take a peek at this free list of growing companies with insider buying.
Please note, the market returns quoted in this article reflect the market weighted average returns of stocks that currently trade on CA exchanges.
Have feedback on this article? Concerned about the content? Get in touch with us directly. Alternatively, email editorial-team (at) simplywallst.com.
This article by Simply Wall St is general in nature. We provide commentary based on historical data and analyst forecasts only using an unbiased methodology and our articles are not intended to be financial advice. It does not constitute a recommendation to buy or sell any stock, and does not take account of your objectives, or your financial situation. We aim to bring you long-term focused analysis driven by fundamental data. Note that our analysis may not factor in the latest price-sensitive company announcements or qualitative material. Simply Wall St has no position in any stocks mentioned.
