
 Yahoo Finance
 Staffline Group (LON:STAF) Could Be At Risk Of Shrinking As A Company
If we're looking to avoid a business that is in decline, what are the trends that can warn us ahead of time? More often than not, we'll see a declining return on capital employed (ROCE) and a declining amount of capital employed. This combination can tell you that not only is the company investing less, it's earning less on what it does invest. So after we looked into Staffline Group (LON:STAF), the trends above didn't look too great.
What Is Return On Capital Employed (ROCE)?
Just to clarify if you're unsure, ROCE is a metric for evaluating how much pre-tax income (in percentage terms) a company earns on the capital invested in its business. The formula for this calculation on Staffline Group is:
Return on Capital Employed = Earnings Before Interest and Tax (EBIT) ÷ (Total Assets - Current Liabilities)
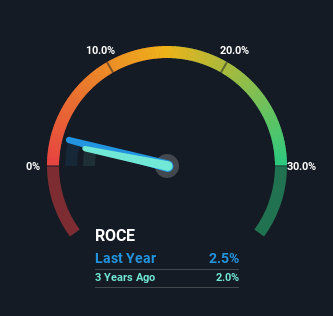
0.025 = UK£1.9m ÷ (UK£216m - UK£139m) (Based on the trailing twelve months to June 2022).
Thus, Staffline Group has an ROCE of 2.5%. Ultimately, that's a low return and it under-performs the Professional Services industry average of 15%.
See our latest analysis for Staffline Group
In the above chart we have measured Staffline Group's prior ROCE against its prior performance, but the future is arguably more important. If you'd like, you can check out the forecasts from the analysts covering Staffline Group here for free.
What The Trend Of ROCE Can Tell Us
We are a bit anxious about the trends of ROCE at Staffline Group. Unfortunately, returns have declined substantially over the last five years to the 2.5% we see today. On top of that, the business is utilizing 43% less capital within its operations. The combination of lower ROCE and less capital employed can indicate that a business is likely to be facing some competitive headwinds or seeing an erosion to its moat. Typically businesses that exhibit these characteristics aren't the ones that tend to multiply over the long term, because statistically speaking, they've already gone through the growth phase of their life cycle.
While on the subject, we noticed that the ratio of current liabilities to total assets has risen to 65%, which has impacted the ROCE. Without this increase, it's likely that ROCE would be even lower than 2.5%. What this means is that in reality, a rather large portion of the business is being funded by the likes of the company's suppliers or short-term creditors, which can bring some risks of its own.
In Conclusion...
In short, lower returns and decreasing amounts capital employed in the business doesn't fill us with confidence. Unsurprisingly then, the stock has dived 96% over the last five years, so investors are recognizing these changes and don't like the company's prospects. With underlying trends that aren't great in these areas, we'd consider looking elsewhere.
Since virtually every company faces some risks, it's worth knowing what they are, and we've spotted 2 warning signs for Staffline Group (of which 1 doesn't sit too well with us!) that you should know about.
While Staffline Group may not currently earn the highest returns, we've compiled a list of companies that currently earn more than 25% return on equity. Check out this free list here.
Have feedback on this article? Concerned about the content? Get in touch with us directly. Alternatively, email editorial-team (at) simplywallst.com.
This article by Simply Wall St is general in nature. We provide commentary based on historical data and analyst forecasts only using an unbiased methodology and our articles are not intended to be financial advice. It does not constitute a recommendation to buy or sell any stock, and does not take account of your objectives, or your financial situation. We aim to bring you long-term focused analysis driven by fundamental data. Note that our analysis may not factor in the latest price-sensitive company announcements or qualitative material. Simply Wall St has no position in any stocks mentioned.
Join A Paid User Research Session
You’ll receive a US$30 Amazon Gift card for 1 hour of your time while helping us build better investing tools for the individual investors like yourself. Sign up here
