
 Yahoo Finance
 Is Sportscene Group Inc.'s (CVE:SPS.A) Balance Sheet Strong Enough To Weather A Storm?

Want to participate in a short research study? Help shape the future of investing tools and you could win a $250 gift card!
Investors are always looking for growth in small-cap stocks like Sportscene Group Inc. (CVE:SPS.A), with a market cap of CA$55m. However, an important fact which most ignore is: how financially healthy is the business? Understanding the company's financial health becomes vital, as mismanagement of capital can lead to bankruptcies, which occur at a higher rate for small-caps. Let's work through some financial health checks you may wish to consider if you're interested in this stock. Nevertheless, this is just a partial view of the stock, and I suggest you dig deeper yourself into SPS.A here.
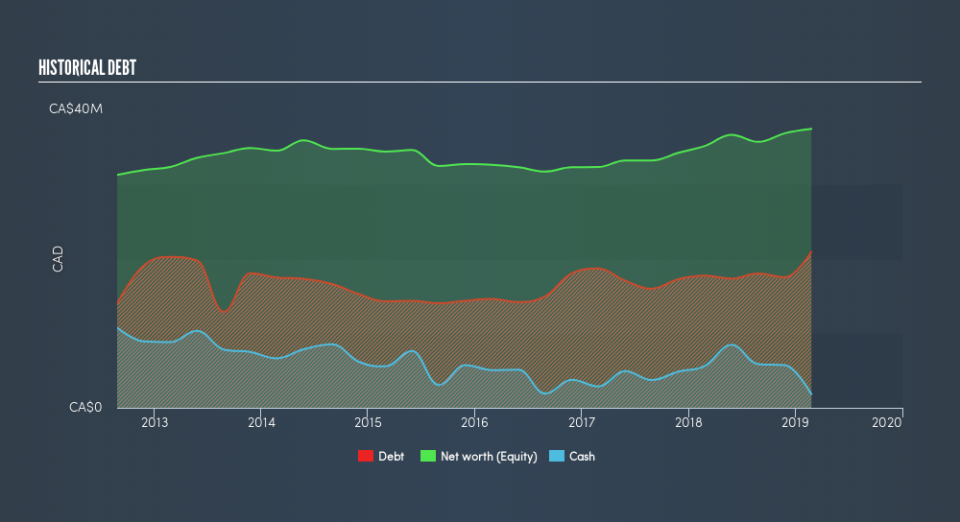
SPS.A’s Debt (And Cash Flows)
SPS.A has built up its total debt levels in the last twelve months, from CA$18m to CA$21m , which includes long-term debt. With this increase in debt, SPS.A currently has CA$1.8m remaining in cash and short-term investments to keep the business going. Additionally, SPS.A has produced cash from operations of CA$6.3m during the same period of time, resulting in an operating cash to total debt ratio of 30%, indicating that SPS.A’s operating cash is sufficient to cover its debt.
Does SPS.A’s liquid assets cover its short-term commitments?
With current liabilities at CA$16m, it appears that the company may not be able to easily meet these obligations given the level of current assets of CA$13m, with a current ratio of 0.83x. The current ratio is the number you get when you divide current assets by current liabilities.
Is SPS.A’s debt level acceptable?
With a debt-to-equity ratio of 56%, SPS.A can be considered as an above-average leveraged company. This is somewhat unusual for small-caps companies, since lenders are often hesitant to provide attractive interest rates to less-established businesses. We can test if SPS.A’s debt levels are sustainable by measuring interest payments against earnings of a company. Ideally, earnings before interest and tax (EBIT) should cover net interest by at least three times. For SPS.A, the ratio of 4.88x suggests that interest is appropriately covered, which means that debtors may be willing to loan the company more money, giving SPS.A ample headroom to grow its debt facilities.
Next Steps:
SPS.A’s high cash coverage means that, although its debt levels are high, the company is able to utilise its borrowings efficiently in order to generate cash flow. However, its lack of liquidity raises questions over current asset management practices for the small-cap. I admit this is a fairly basic analysis for SPS.A's financial health. Other important fundamentals need to be considered alongside. I suggest you continue to research Sportscene Group to get a more holistic view of the stock by looking at:
Future Outlook: What are well-informed industry analysts predicting for SPS.A’s future growth? Take a look at our free research report of analyst consensus for SPS.A’s outlook.
Historical Performance: What has SPS.A's returns been like over the past? Go into more detail in the past track record analysis and take a look at the free visual representations of our analysis for more clarity.
Other High-Performing Stocks: Are there other stocks that provide better prospects with proven track records? Explore our free list of these great stocks here.
We aim to bring you long-term focused research analysis driven by fundamental data. Note that our analysis may not factor in the latest price-sensitive company announcements or qualitative material.
If you spot an error that warrants correction, please contact the editor at editorial-team@simplywallst.com. This article by Simply Wall St is general in nature. It does not constitute a recommendation to buy or sell any stock, and does not take account of your objectives, or your financial situation. Simply Wall St has no position in the stocks mentioned. Thank you for reading.
