
 Yahoo Finance
 Is Sportscene Group Inc.’s (CVE:SPS.A) P/E Ratio Really That Good?

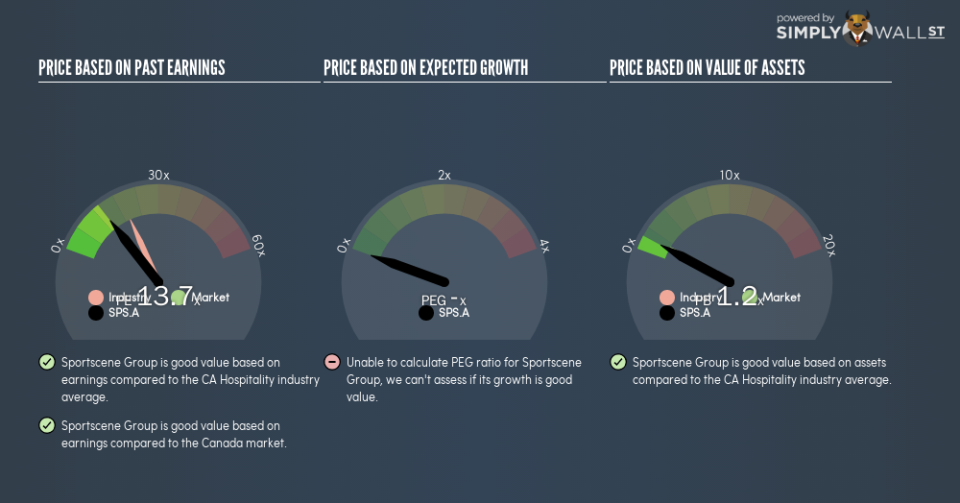
This article is for investors who would like to improve their understanding of price to earnings ratios (P/E ratios). We’ll show how you can use Sportscene Group Inc.’s (CVE:SPS.A) P/E ratio to inform your assessment of the investment opportunity. Sportscene Group has a P/E ratio of 13.73, based on the last twelve months. That is equivalent to an earnings yield of about 7.3%.
Check out our latest analysis for Sportscene Group
Want to help shape the future of investing tools and platforms? Take the survey and be part of one of the most advanced studies of stock market investors to date.
How Do I Calculate A Price To Earnings Ratio?
The formula for price to earnings is:
Price to Earnings Ratio = Price per Share ÷ Earnings per Share (EPS)
Or for Sportscene Group:
P/E of 13.73 = CA$9.95 ÷ CA$0.72 (Based on the year to August 2018.)
Is A High P/E Ratio Good?
A higher P/E ratio means that investors are paying a higher price for each CA$1 of company earnings. All else being equal, it’s better to pay a low price — but as Warren Buffett said, ‘It’s far better to buy a wonderful company at a fair price than a fair company at a wonderful price.’
How Growth Rates Impact P/E Ratios
Earnings growth rates have a big influence on P/E ratios. That’s because companies that grow earnings per share quickly will rapidly increase the ‘E’ in the equation. That means unless the share price increases, the P/E will reduce in a few years. Then, a lower P/E should attract more buyers, pushing the share price up.
It’s nice to see that Sportscene Group grew EPS by a stonking 99% in the last year. And earnings per share have improved by 117% annually, over the last three years. With that performance, I would expect it to have an above average P/E ratio. Unfortunately, earnings per share are down 12% a year, over 5 years.
How Does Sportscene Group’s P/E Ratio Compare To Its Peers?
The P/E ratio essentially measures market expectations of a company. The image below shows that Sportscene Group has a lower P/E than the average (19.4) P/E for companies in the hospitality industry.
Sportscene Group’s P/E tells us that market participants think it will not fare as well as its peers in the same industry. Since the market seems unimpressed with Sportscene Group, it’s quite possible it could surprise on the upside. If you consider the stock interesting, further research is recommended. For example, I often monitor director buying and selling.
Remember: P/E Ratios Don’t Consider The Balance Sheet
The ‘Price’ in P/E reflects the market capitalization of the company. Thus, the metric does not reflect cash or debt held by the company. Theoretically, a business can improve its earnings (and produce a lower P/E in the future), by taking on debt (or spending its remaining cash).
Such spending might be good or bad, overall, but the key point here is that you need to look at debt to understand the P/E ratio in context.
Sportscene Group’s Balance Sheet
Sportscene Group has net debt worth 29% of its market capitalization. This is a reasonably significant level of debt — all else being equal you’d expect a much lower P/E than if it had net cash.
The Verdict On Sportscene Group’s P/E Ratio
Sportscene Group trades on a P/E ratio of 13.7, which is fairly close to the CA market average of 13.8. Given it has reasonable debt levels, and grew earnings strongly last year, the P/E indicates the market has doubts this growth can be sustained.
Investors have an opportunity when market expectations about a stock are wrong. If it is underestimating a company, investors can make money by buying and holding the shares until the market corrects itself. We don’t have analyst forecasts, but you could get a better understanding of its growth by checking out this more detailed historical graph of earnings, revenue and cash flow.
You might be able to find a better buy than Sportscene Group. If you want a selection of possible winners, check out this free list of interesting companies that trade on a P/E below 20 (but have proven they can grow earnings).
To help readers see past the short term volatility of the financial market, we aim to bring you a long-term focused research analysis purely driven by fundamental data. Note that our analysis does not factor in the latest price-sensitive company announcements.
The author is an independent contributor and at the time of publication had no position in the stocks mentioned. For errors that warrant correction please contact the editor at editorial-team@simplywallst.com.
