
 Yahoo Finance
 Spire Healthcare Group's (LON:SPI) Returns Have Hit A Wall
What are the early trends we should look for to identify a stock that could multiply in value over the long term? In a perfect world, we'd like to see a company investing more capital into its business and ideally the returns earned from that capital are also increasing. If you see this, it typically means it's a company with a great business model and plenty of profitable reinvestment opportunities. Having said that, from a first glance at Spire Healthcare Group (LON:SPI) we aren't jumping out of our chairs at how returns are trending, but let's have a deeper look.
Return On Capital Employed (ROCE): What Is It?
For those that aren't sure what ROCE is, it measures the amount of pre-tax profits a company can generate from the capital employed in its business. Analysts use this formula to calculate it for Spire Healthcare Group:
Return on Capital Employed = Earnings Before Interest and Tax (EBIT) ÷ (Total Assets - Current Liabilities)
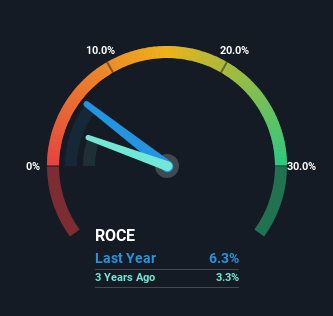
0.063 = UK£119m ÷ (UK£2.2b - UK£286m) (Based on the trailing twelve months to June 2023).
Therefore, Spire Healthcare Group has an ROCE of 6.3%. In absolute terms, that's a low return and it also under-performs the Healthcare industry average of 13%.
See our latest analysis for Spire Healthcare Group
Above you can see how the current ROCE for Spire Healthcare Group compares to its prior returns on capital, but there's only so much you can tell from the past. If you'd like, you can check out the forecasts from the analysts covering Spire Healthcare Group here for free.
What Can We Tell From Spire Healthcare Group's ROCE Trend?
Things have been pretty stable at Spire Healthcare Group, with its capital employed and returns on that capital staying somewhat the same for the last five years. Businesses with these traits tend to be mature and steady operations because they're past the growth phase. So don't be surprised if Spire Healthcare Group doesn't end up being a multi-bagger in a few years time.
Our Take On Spire Healthcare Group's ROCE
We can conclude that in regards to Spire Healthcare Group's returns on capital employed and the trends, there isn't much change to report on. Yet to long term shareholders the stock has gifted them an incredible 100% return in the last five years, so the market appears to be rosy about its future. However, unless these underlying trends turn more positive, we wouldn't get our hopes up too high.
If you'd like to know about the risks facing Spire Healthcare Group, we've discovered 1 warning sign that you should be aware of.
While Spire Healthcare Group may not currently earn the highest returns, we've compiled a list of companies that currently earn more than 25% return on equity. Check out this free list here.
Have feedback on this article? Concerned about the content? Get in touch with us directly. Alternatively, email editorial-team (at) simplywallst.com.
This article by Simply Wall St is general in nature. We provide commentary based on historical data and analyst forecasts only using an unbiased methodology and our articles are not intended to be financial advice. It does not constitute a recommendation to buy or sell any stock, and does not take account of your objectives, or your financial situation. We aim to bring you long-term focused analysis driven by fundamental data. Note that our analysis may not factor in the latest price-sensitive company announcements or qualitative material. Simply Wall St has no position in any stocks mentioned.
