
 Yahoo Finance
 Spin Master (TSE:TOY) Will Be Hoping To Turn Its Returns On Capital Around
There are a few key trends to look for if we want to identify the next multi-bagger. One common approach is to try and find a company with returns on capital employed (ROCE) that are increasing, in conjunction with a growing amount of capital employed. Ultimately, this demonstrates that it's a business that is reinvesting profits at increasing rates of return. So while Spin Master (TSE:TOY) has a high ROCE right now, lets see what we can decipher from how returns are changing.
Return On Capital Employed (ROCE): What Is It?
Just to clarify if you're unsure, ROCE is a metric for evaluating how much pre-tax income (in percentage terms) a company earns on the capital invested in its business. The formula for this calculation on Spin Master is:
Return on Capital Employed = Earnings Before Interest and Tax (EBIT) ÷ (Total Assets - Current Liabilities)
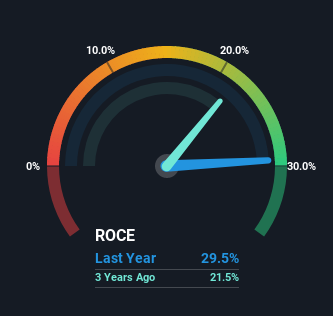
0.29 = US$382m ÷ (US$1.7b - US$432m) (Based on the trailing twelve months to June 2022).
So, Spin Master has an ROCE of 29%. On its own, that's a very good return and it's on par with the returns earned by companies in a similar industry.
Check out our latest analysis for Spin Master
Above you can see how the current ROCE for Spin Master compares to its prior returns on capital, but there's only so much you can tell from the past. If you'd like to see what analysts are forecasting going forward, you should check out our free report for Spin Master.
How Are Returns Trending?
In terms of Spin Master's historical ROCE movements, the trend isn't fantastic. While it's comforting that the ROCE is high, five years ago it was 47%. However, given capital employed and revenue have both increased it appears that the business is currently pursuing growth, at the consequence of short term returns. And if the increased capital generates additional returns, the business, and thus shareholders, will benefit in the long run.
On a side note, Spin Master has done well to pay down its current liabilities to 25% of total assets. So we could link some of this to the decrease in ROCE. Effectively this means their suppliers or short-term creditors are funding less of the business, which reduces some elements of risk. Since the business is basically funding more of its operations with it's own money, you could argue this has made the business less efficient at generating ROCE.
What We Can Learn From Spin Master's ROCE
In summary, despite lower returns in the short term, we're encouraged to see that Spin Master is reinvesting for growth and has higher sales as a result. These trends are starting to be recognized by investors since the stock has delivered a 1.1% gain to shareholders who've held over the last five years. Therefore we'd recommend looking further into this stock to confirm if it has the makings of a good investment.
One more thing to note, we've identified 1 warning sign with Spin Master and understanding it should be part of your investment process.
If you'd like to see other companies earning high returns, check out our free list of companies earning high returns with solid balance sheets here.
Have feedback on this article? Concerned about the content? Get in touch with us directly. Alternatively, email editorial-team (at) simplywallst.com.
This article by Simply Wall St is general in nature. We provide commentary based on historical data and analyst forecasts only using an unbiased methodology and our articles are not intended to be financial advice. It does not constitute a recommendation to buy or sell any stock, and does not take account of your objectives, or your financial situation. We aim to bring you long-term focused analysis driven by fundamental data. Note that our analysis may not factor in the latest price-sensitive company announcements or qualitative material. Simply Wall St has no position in any stocks mentioned.
Join A Paid User Research Session
You’ll receive a US$30 Amazon Gift card for 1 hour of your time while helping us build better investing tools for the individual investors like yourself. Sign up here
