
 Yahoo Finance
 What Is Spectra's (CVE:SSA) P/E Ratio After Its Share Price Rocketed?

It's great to see Spectra (CVE:SSA) shareholders have their patience rewarded with a 50% share price pop in the last month. Looking back a bit further, we're also happy to report the stock is up 88% in the last year.
Assuming no other changes, a sharply higher share price makes a stock less attractive to potential buyers. While the market sentiment towards a stock is very changeable, in the long run, the share price will tend to move in the same direction as earnings per share. The implication here is that deep value investors might steer clear when expectations of a company are too high. Perhaps the simplest way to get a read on investors' expectations of a business is to look at its Price to Earnings Ratio (PE Ratio). A high P/E implies that investors have high expectations of what a company can achieve compared to a company with a low P/E ratio.
View our latest analysis for Spectra
How Does Spectra's P/E Ratio Compare To Its Peers?
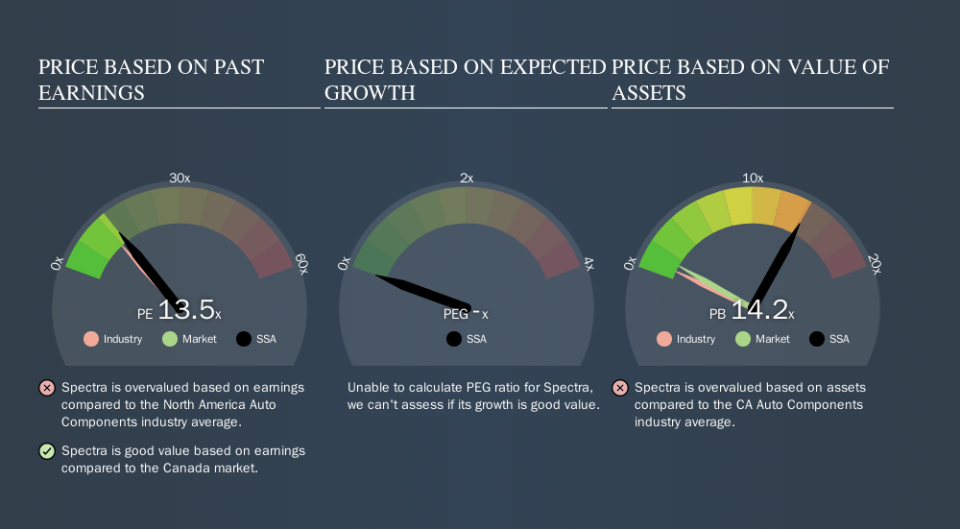
Spectra's P/E of 13.49 indicates some degree of optimism towards the stock. As you can see below, Spectra has a higher P/E than the average company (11.6) in the auto components industry.
Its relatively high P/E ratio indicates that Spectra shareholders think it will perform better than other companies in its industry classification. Shareholders are clearly optimistic, but the future is always uncertain. So investors should delve deeper. I like to check if company insiders have been buying or selling.
How Growth Rates Impact P/E Ratios
Generally speaking the rate of earnings growth has a profound impact on a company's P/E multiple. That's because companies that grow earnings per share quickly will rapidly increase the 'E' in the equation. That means even if the current P/E is high, it will reduce over time if the share price stays flat. So while a stock may look expensive based on past earnings, it could be cheap based on future earnings.
Spectra's earnings made like a rocket, taking off 71% last year. Even better, EPS is up 56% per year over three years. So you might say it really deserves to have an above-average P/E ratio.
Don't Forget: The P/E Does Not Account For Debt or Bank Deposits
The 'Price' in P/E reflects the market capitalization of the company. That means it doesn't take debt or cash into account. In theory, a company can lower its future P/E ratio by using cash or debt to invest in growth.
While growth expenditure doesn't always pay off, the point is that it is a good option to have; but one that the P/E ratio ignores.
So What Does Spectra's Balance Sheet Tell Us?
Since Spectra holds net cash of CA$151k, it can spend on growth, justifying a higher P/E ratio than otherwise.
The Bottom Line On Spectra's P/E Ratio
Spectra has a P/E of 13.5. That's around the same as the average in the CA market, which is 13.8. Its net cash position is the cherry on top of its superb EPS growth. So based on this analysis we'd expect Spectra to have a higher P/E ratio. What we know for sure is that investors have become more excited about Spectra recently, since they have pushed its P/E ratio from 9.0 to 13.5 over the last month. For those who prefer to invest with the flow of momentum, that might mean it's time to put the stock on a watchlist, or research it. But the contrarian may see it as a missed opportunity.
Investors have an opportunity when market expectations about a stock are wrong. If the reality for a company is not as bad as the P/E ratio indicates, then the share price should increase as the market realizes this. Although we don't have analyst forecasts you might want to assess this data-rich visualization of earnings, revenue and cash flow.
But note: Spectra may not be the best stock to buy. So take a peek at this free list of interesting companies with strong recent earnings growth (and a P/E ratio below 20).
We aim to bring you long-term focused research analysis driven by fundamental data. Note that our analysis may not factor in the latest price-sensitive company announcements or qualitative material.
If you spot an error that warrants correction, please contact the editor at editorial-team@simplywallst.com. This article by Simply Wall St is general in nature. It does not constitute a recommendation to buy or sell any stock, and does not take account of your objectives, or your financial situation. Simply Wall St has no position in the stocks mentioned. Thank you for reading.
