
 Yahoo Finance
 Soybeans Outlook Relies On China’s Ravenous Appetite
As the soy market becomes more complicated in many ways, it also remains pretty simple when it comes to China.
With the price of corn and wheat in the doldrums, farmers will be contemplating replacing acreage with soybeans. The USDA’s Prospective Plantings report, published on March 31, could influence any decision.
U.S. Production And Trade
After corn, soybeans are the second-biggest crop in the U.S., followed by hay and wheat. Soybeans also have the second-largest planted crop area (76.8 million acres 2013/14) in the country.
U.S. Planted Crop Areas
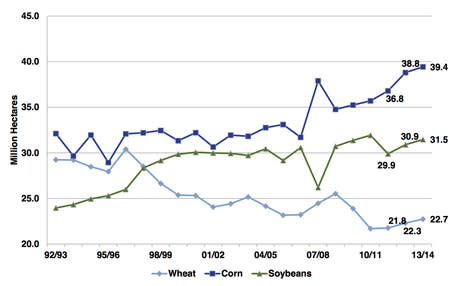
Source: U.S. Wheat Associates (from USDA data – Crop Acreage Report : 6/30/14)
The U.S. is not only the world’s largest producer of soybeans, it is also its largest exporter.
World Soybean Production – 2014/15 (March) ('000 Metric Tonnes)
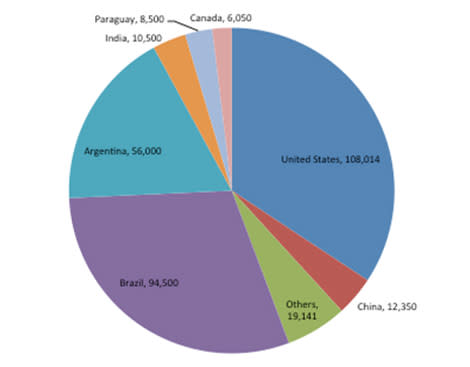
Source: USDA, FAS Oilseeds: World Markets and Trade, March 10, 2015
Soybean Exporters – Leading Countries ('000 Metric Tonnes – Marketing Year)
2013/14 | Mar 2014/15 | |
USA | 44,815 | 48,716 |
Brazil | 46,829 | 46,000 |
Argentina | 7,842 | 8,000 |
Paraguay | 4,800 | 4,800 |
Canada | 3,471 | 3,700 |
Other | 5,278 | 6,201 |
Source: USDA, FAS Oilseeds: World Markets and Trade, March 10, 2015
10 Largest Importers of Soybeans – 2014/15 (March) ('000s Metric Tonnes)
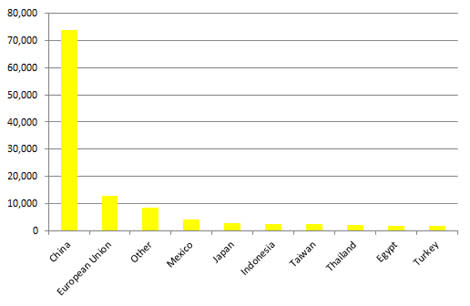
Source: USDA, FAS Grain: World Markets and Trade, March 10, 2015
On March 10, 2015, the USDA published the Foreign Agricultural Service updates to its production, supply and distribution database and released its World Agricultural Supply and Demand Estimates (WASDE).
According to the WASDE report, in the year 2014/2015, global soybean production is projected to be a record 315.1 million tons, with Brazil soybean production projected at 94.5 million tons, Argentina at 56.0 million and Paraguay at 8.5 million. For the same period, U.S. soybean crush and exports are projected at 1,795 million bushels (48.9 million tons) and 1,790 million bushels (48.7 million tons) respectively, ending stocks remain projected at an eight-year high of 385 million bushels (10.5 million tons).
Of these exports, the primary destination is China. And, as noted in a recent paper from the Department of Agricultural and Consumer Economics at the University of Illinois Urbana-Champaign, so far this marketing year, “nearly one out of every four bushels of soybeans produced, or 13 bushels per acre, has been shipped to China.”
While yields have recently gone up and are expected to rise in 2014/15, it remains to be seen whether this season’s acreages—both planted and harvested—rise as sharply as the USDA appears to be anticipating.
U.S Soybean Area Planted and Harvested (Million Acres) and Yield
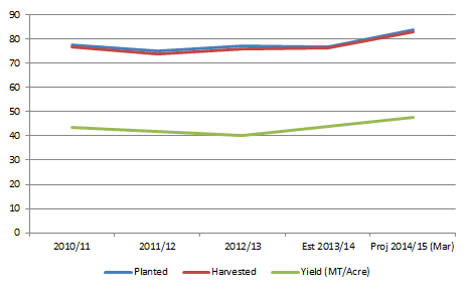
Source: USDA data
Uses
According to Soyatech LLC, some 85 percent of the world’s soybeans are processed, or "crushed," annually into soybean meal and oil. Around 98 percent of the soybean meal that is crushed is further processed into animal feed, with the balance used to make soy flour and proteins. Of the oil fraction, 95 percent is consumed as edible oil. The remainder is used for industrial products such as fatty acids, soaps and biodiesel.
U.S. Soy Usage (Million Bushels)
2010/11 | 2011/12 | 2012/13 | 2013/14† | 2014/15* | |
Crush | 1,648 | 1,703 | 1,689 | 1,734 | 1,805 |
Seed & Residual | 131 | 88 | 105 | 97 | 121 |
Exports | 1,501 | 1,365 | 1,317 | 1,647 | 1,820 |
Total | 3,280 | 3,156 | 3,111 | 3,478 | 3,746 |
Source: Agriculture Marketing Resource Center, Iowa State University (Figures as at 3/20/15)
† Preliminary * Estimated
U.S. Biodiesel Usage
2010/11 | 2011/12 | 2012/13 | 2013/14† | 2014/15* | |
Soybean oil use for biodiesel1 | 2,737 | 4,870 | 4,689 | 4,800 | 4,700 |
Use for biodeisel2 | 237 | 420 | 402 | 412 | 409 |
Soybean oil for biodiesel, % oil from crop | 7.10% | 13.60% | 13.20% | 12.30% | 10.30% |
Soybean oil from biodiesel, % of oil from crush | 14.40% | 24.60% | 23.60% | 23.80% | 22.60% |
Source: Agriculture Marketing Resource Center, Iowa State University (Figures as at 3/20/15)
† Preliminary * Estimated 1 Million lbs 2 Bushel equivalent
Of the edible fats and oils consumed in the U.S., it is estimated that at least 80 percent comes from soybeans. These include:
Cooking oil
Margarine
Salad dressings
Shortening
Its industrial uses include:
Caulking compounds
Industrial paints
Linoleum
Printing inks
Varnishes
Factors Affecting The Soybean Market
The soybean market is nothing if not complex on many—often intersecting—levels. As with both wheat and corn (see Wheat’s Dilemma: Bumper Harvests Meet Waning Demand and With Corn Swimming In Supply, A Difficult Market Gets No Relief), politics can also play an important role in the fortunes of soybeans, from Argentina to China.
In these two countries, the particular issue is yearly ending stocks, i.e., unused soybeans, and their levels. While in the U.S. and Brazil, these levels have dropped, in China and Argentina, they have risen. And since 2000, China’s share of such stocks has increased around 1 percent a year.
Share of World Ending Stocks: 2000-2004 vs 2010-2014
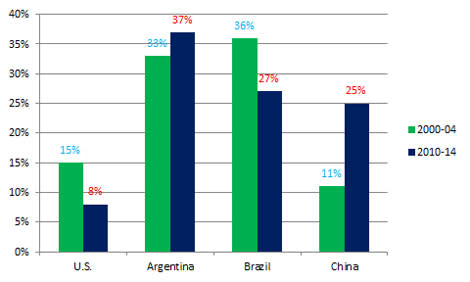
Source: Department of Agricultural and Consumer Economics, University of Illinois Urbana-Champaign
In Argentina’s case, farmers have stockpiled and are not selling their record soybean crop, not least because of a 35 percent export tax. In turn, the U.S. has taken advantage of the situation in Argentina to export more soybean meal.
In China, it is perhaps a different story, one that revolves around just what level of soybean stocks the government sees as desirable. As Carl Zulauf of the Department of Agricultural and Consumer Economics, University of Illinois Urbana-Champaign points out in his excellent paper, “Some Key Trends in the World Soybean Market,” admittedly, it is a very different market: “China is currently projected to hold 59 percent of ending 2014 world cotton stocks and its cotton stocks equal 184 percent of its projected use of cotton.” One has to wonder just where it is going with soybeans.
(Over and above the fact that considerable soybean stocks may remain at the end of each year, it is vitally important to understand—in contrast with some of the other commodity markets, for example copper—just how rapidly and the degree to which, especially in the soybean market, supply and demand dynamics can change. Why? One of the reasons is simple: There are two growing seasons—one in the northern hemisphere and one in the southern.)
Market Getting More Complex
Aside from such country-level political considerations, the market has become increasingly complex over the years, not least because of the increase in information (varying in both timeliness and quality) now available.
In a recent article in the Ohio Country Journal titled “Soybean price outlook challenging in a complex world market,” Warren Feather, merchandising manager of Cargill’s soybean processing and soybean export business in North America, illustrates this increasing complexity nicely. He says that, not too long ago, “… the markets watched weather in the Corn Belt, European bean and meal imports, Russian grain and meal purchases, government programs, USDA reports, and commercial information positions.”
He seems to remember that, when he started, he didn’t even have a computer. But now he says he has three computer screens on his desk and watches “…weather in South America, India and China, Chinese imports, animal diseases, hedge fund activity, Brazilian currency, worldwide farmer selling and retention, livestock profitability, biofuel mandates, other commodity markets like crude oil, and consumer trends like non-GMO.”
Global Production Shift
On a very broad level, too, the market has changed considerably over the last decade and more. Perhaps the two most important changes have been the shift in global soybean production and the consolidation of China’s position in the market.
On the one hand, soybean production has moved away from the U.S. to Latin America, in particular to Argentina and Brazil. Since 2000, this has resulted in a drop in the U.S. share of world production from 43 percent to 34 percent, and an increase in the share of Argentina and Brazil from 38 percent to 48 percent.
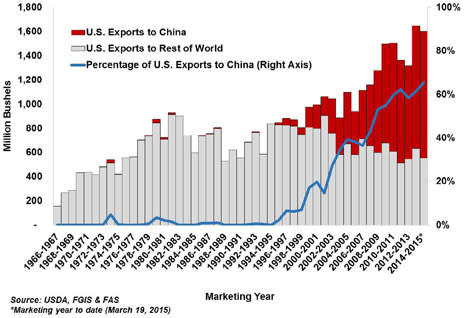
On the other hand, since 2000, China’s share of global soybean imports has grown from just 28 percent to 65 percent. While the country’s share of global imports may have risen, it is the increase in its share of exports from the U.S. that is particularly important to note.
Back in 1995, of the 851 million bushels the U.S. exported, approximately 2 percent (18 million bushels) were headed off to China. For the 2014/15 marketing year, the USDA estimates that, of U.S. exports of 1.604 billion bushels, some 1.049 billion (65 percent) will go to China.
Global and U.S. Exports to China
Share of World Ending Stocks: 2000-2004 vs 2010-2014
Source: Department of Agricultural and Consumer Economics, University of Illinois Urbana-Champaign
Over the last 10 years, demand from China has accounted for 97 percent of the growth of the global soybean trade. While its consumption of soybean meal has gone up approximately 145 percent in this period, that of the EU and U.S. has gone down. As can be seen, the country has a significant presence in the market.
Two Big Drivers Of Demand
GDP and population growth (on a global, regional country levels) can probably be considered as the two most important long-term drivers of demand for soybean meal and oil.
Therefore, any slowdown in China’s economic growth is likely to have some impact on both the global and the U.S. soybean market, not least in terms of a possible slowdown in the growth of its soybean imports. If the country maintains its appetite for soybeans, then one of the most important factors for domestic U.S. producers and U.S. exports will be the value of the U.S. dollar and the extent to which its competitors in the market can take advantage of this.
No brief look at some of the factors affecting the soybean market—in this case, soymeal and soybean oil—should omit two other areas. First dried distillers grains (DDGs): DDGs are the nutrient-rich co-product of dry-milled ethanol production, used extensively as a feed ingredient. They have, with varying degrees of effectiveness, been competitors to soymeal’s use in the U.S.
Second, canola, palm and sunflower oil have also been contenders against soybean oil. But depending on how the market’s looking at any particular time, soybean oil can also be seen by them as a contender.
USDA Prospective Plantings Report
The findings for soybeans were pleasantly surprising: “Soybean planted area for 2015 is estimated at record high 84.6 million acres, up 1 percent from last year. Compared with last year, planted acreage intentions are up or unchanged in 21 of the 31 major producing States.”
The 84.6 million acres figure was 1.3 million acres below the average trade estimate of 85.9 million acres. Some thought such a small increase a good sign for the crop.
Inventories at the beginning of March were 1.334 billion bushels. Albeit 34 percent, or 994 million bushels, up on the previous year, this figure was below analysts’ expected figure of 1.348 billion bushels—another encouraging sign.
One conclusion that could be drawn from the inventory figures is that the stronger U.S. dollar may not be hurting exports as much as it could. The big question going forward is whether China’s appetite for the bean remains unabated.
For a producer of which it can be said, once again, that “[t]hus far during the marketing year, nearly one out of every four bushels of soybeans produced, or 13 bushels per acre, has been shipped to China,” the country’s remaining ravenous is quite important.
Recommended Stories
Smaller Inventory Withdrawal Still Bullish For Natural Gas As Price Rally Pauses
NatGas In Early Stages Of Rebalancing Process, Prices To Fall Further
Six Regions Drive 90% Of US Oil Production Growth, 100% Of NatGas Growth
The Commodity Investor: Here’s What To Buy To Profit From The Coming Rebound In Gold Miners
