
 Yahoo Finance
 Southwest Airlines (LUV) Incurs Q1 Loss on Higher Expenses

Southwest Airlines Co. (LUV) reported first-quarter 2024 loss of 36 cents per share, which was wider than the Zacks Consensus Estimate loss of 34 cents. In the year-ago reported quarter, LUV incurred a loss of 27 cents per share.
Revenues of $6,329 million missed the Zacks Consensus Estimate of $6,451 million but improved 10.9% year over year. The uptick was owing to solid demand trends, coupled with record first-quarter passenger and ancillary revenues, passengers carried, and new Rapid Rewards Members. First-quarter 2024 managed business revenues strengthened sequentially, and improved 25% year over year. Network optimization adjustments also acted as another tailwind.
Despite costs being a concern, LUV continues to enjoy benefits from its ongoing cost-reduction initiatives and remains focused on enhancing productivity and controlling discretionary spending. Further, LUV has ratified agreements with 11 of its labor groups in the last 18 months.
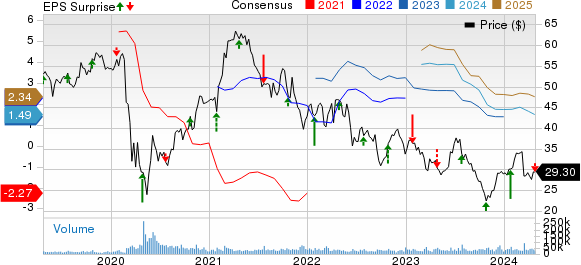
Southwest Airlines Co. Price, Consensus and EPS Surprise
Southwest Airlines Co. price-consensus-eps-surprise-chart | Southwest Airlines Co. Quote
Operating Statistics
Airline traffic, measured in revenue passenger miles, increased 12% year over year to 33.08 billion in the quarter under review. Capacity or available seat miles (ASMs) climbed 11% year over year to 42.24 billion. Load factor (percentage of seats filled by passengers) rose to 78.3% from 77.6% in the year-ago quarter.The actual figure for the load factor was lower than our expectation of 80%.
Passenger revenue per available seat mile (PRASM: a key measure of unit revenues) grew 0.8% year over year to 13.52 cents.The actual figure was lower than our estimate of 13.92 cents.
Revenue per available seat mile (RASM) fell 0.1% to 14.98 cents.The actual figure was lower than our estimate of 15.34 cents.
Operating Expenses & Income
In the first quarter, Southwest Airlines incurred an operating loss (as reported) of $393 million, compared with $284 million in the year-ago quarter. On an adjusted basis (excluding special items), the company reported operating income of $377 million against a loss of $284 million in the year-ago reported quarter.
Total adjusted operating expenses (excluding profit sharing, special items, fuel and oil expenses) increased 16.5%.
Fuel cost per gallon (inclusive of fuel tax: economic) fell 8.5% to $2.92. The actual figure was higher than our estimate of $2.52.
Consolidated unit cost or cost per available seat mile (CASM) excluding fuel, oil and profit-sharing expenses, and special items grew 5% year over year.
Liquidity
Southwest Airlines ended the first quarter with cash and cash equivalents of $8,367 million compared with $9,288 million at the end of December 2023. As of Mar 31, 2024, the company had long-term debt (less current maturities) of $7,974 million compared with $7,978 million at the end of the fourth quarter.
LUV utilized $104 million of cash in operating activities in the reported quarter, while CapEx was $583 million.
Q2 & Full-Year Outlook
For second-quarter 2024, ASMs are estimated to improve 8-9% from the year-ago reported figure. Economic fuel costs per gallonare expected to be between $2.70 and $2.80. RASM is anticipated to decline 1.5% to 3.5% from the year-ago reported figure. LUV expects CASM, excluding fuel, oil and profit-sharing expenses, and special items, to increase 6.5-7.5% in the second quarter from the comparable period in 2023. Interest expenses are expected to be $62 million in the second quarter.
For 2024, LUV has updated its guidance. Management now expects capacity to improve 4% (prior view: 6%) from the 2023 level. Economic fuel costs per gallon are now estimated to be between $2.70 and $2.80 (prior view: $2.55 and $2.65). CASM, excluding fuel, oil and profit-sharing expenses, and special items, is still anticipated to increase 7-8% (prior view: up5.5% to 7%)in 2024 from 2023.
Interest expenses are now expected to be $252 million (prior view: $249 million) in 2024. The effective tax rate is now expected to be in the range of 24%-25% (prior view: 23-24%) in the year. Capital expenditures are now anticipated to be around $2.5 billion (prior view: $3.5-$4 billion) for 2024.
Currently, Southwest Airlines carries a Zacks Rank #3 (Hold).
You can see the complete list of today’s Zacks #1 Rank (Strong Buy) stocks here.
Performances of Other Transportation Companies
Delta Air Lines DAL reported first-quarter 2024 earnings (excluding 39 cents from non-recurring items) of 45 cents per share, which comfortably beat the Zacks Consensus Estimate of 36 cents. Earnings increased 80% on a year-over-year basis.
Revenues of $13.75 billion surpassed the Zacks Consensus Estimate of $12.84 billion and increased 7.75% on a year-over-year basis, driven by strong air-travel demand. Adjusted operating revenues (excluding third-party refinery sales) came in at $12.56 billion, up 6% year over year.
United Airlines Holdings, Inc. UAL reported first-quarter 2024 loss per share (excluding 23 cents from non-recurring items) of 15 cents, which was narrower than the Zacks Consensus Estimate of a loss of 53 cents. In the year-ago reported quarter, UAL reported a loss of 63 cents per share.
Operating revenues of $12,539 million beat the Zacks Consensus Estimate of $12,428.4 million. The top line increased 9.7% year over year due to upbeat air-travel demand. This was driven by a 10.1% rise in passenger revenues (accounting for 90.2% of the top line) to $11,313 million. Almost 39,325 passengers traveled on UAL flights in the first quarter, up 6.8% year over year.
J.B. Hunt Transport Services, Inc.’s JBHT first-quarter 2024 earnings of $1.22 per share missed the Zacks Consensus Estimate of $1.53 and declined 35.5% year over year.
JBHT’s total operating revenues of $2,944 million missed the Zacks Consensus Estimate of $3,117.1 million and fell 8.8% year over year. Total operating revenues, excluding fuel surcharge revenue, fell 7% year over year. The downfall was owing to a 9% decrease in segment gross revenue per load in both Intermodal (JBI) and Truckload (JBT), 22% fewer loads in Integrated Capacity Solution (ICS), and a modest decline in average trucks and productivity in Dedicated Contract Services (DCS). Revenue declines in JBI, ICS, JBT and DCS were partially offset by Final Mile Services (FMS) revenue growth of 2%, primarily driven by new contracts implemented over the past year.
Want the latest recommendations from Zacks Investment Research? Today, you can download 7 Best Stocks for the Next 30 Days. Click to get this free report
Delta Air Lines, Inc. (DAL) : Free Stock Analysis Report
United Airlines Holdings Inc (UAL) : Free Stock Analysis Report
Southwest Airlines Co. (LUV) : Free Stock Analysis Report
J.B. Hunt Transport Services, Inc. (JBHT) : Free Stock Analysis Report
