
 Yahoo Finance
 Is Solvay SA’s (EBR:SOLB) P/E Ratio Really That Good?

Want to participate in a short research study? Help shape the future of investing tools and receive a $20 prize!
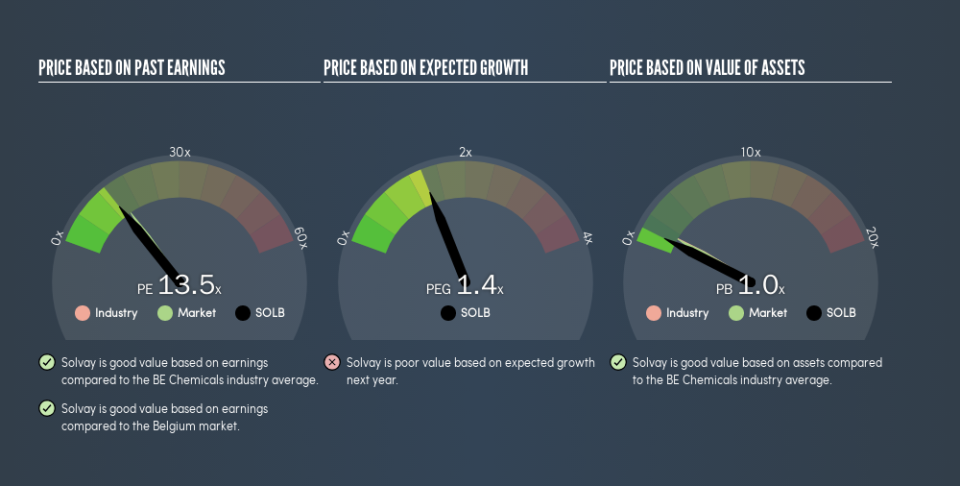
This article is written for those who want to get better at using price to earnings ratios (P/E ratios). We’ll show how you can use Solvay SA’s (EBR:SOLB) P/E ratio to inform your assessment of the investment opportunity. Based on the last twelve months, Solvay’s P/E ratio is 13.52. In other words, at today’s prices, investors are paying €13.52 for every €1 in prior year profit.
See our latest analysis for Solvay
How Do I Calculate Solvay’s Price To Earnings Ratio?
The formula for P/E is:
Price to Earnings Ratio = Price per Share ÷ Earnings per Share (EPS)
Or for Solvay:
P/E of 13.52 = €99.56 ÷ €7.36 (Based on the trailing twelve months to September 2018.)
Is A High P/E Ratio Good?
A higher P/E ratio means that investors are paying a higher price for each €1 of company earnings. All else being equal, it’s better to pay a low price — but as Warren Buffett said, ‘It’s far better to buy a wonderful company at a fair price than a fair company at a wonderful price.’
How Growth Rates Impact P/E Ratios
Probably the most important factor in determining what P/E a company trades on is the earnings growth. Earnings growth means that in the future the ‘E’ will be higher. That means even if the current P/E is high, it will reduce over time if the share price stays flat. Then, a lower P/E should attract more buyers, pushing the share price up.
Solvay shrunk earnings per share by 1.2% last year. But it has grown its earnings per share by 21% per year over the last five years.
How Does Solvay’s P/E Ratio Compare To Its Peers?
The P/E ratio essentially measures market expectations of a company. As you can see below Solvay has a P/E ratio that is fairly close for the average for the chemicals industry, which is 13.7.
Solvay’s P/E tells us that market participants think its prospects are roughly in line with its industry. If the company has better than average prospects, then the market might be underestimating it. Checking factors such as the tenure of the board and management could help you form your own view on if that will happen.
A Limitation: P/E Ratios Ignore Debt and Cash In The Bank
The ‘Price’ in P/E reflects the market capitalization of the company. Thus, the metric does not reflect cash or debt held by the company. Theoretically, a business can improve its earnings (and produce a lower P/E in the future), by taking on debt (or spending its remaining cash).
Such expenditure might be good or bad, in the long term, but the point here is that the balance sheet is not reflected by this ratio.
Solvay’s Balance Sheet
Solvay’s net debt is 33% of its market cap. This is a reasonably significant level of debt — all else being equal you’d expect a much lower P/E than if it had net cash.
The Verdict On Solvay’s P/E Ratio
Solvay trades on a P/E ratio of 13.5, which is below the BE market average of 14.8. Since it only carries a modest debt load, it’s likely the low expectations implied by the P/E ratio arise from the lack of recent earnings growth.
When the market is wrong about a stock, it gives savvy investors an opportunity. If it is underestimating a company, investors can make money by buying and holding the shares until the market corrects itself. So this free visual report on analyst forecasts could hold the key to an excellent investment decision.
Of course, you might find a fantastic investment by looking at a few good candidates. So take a peek at this free list of companies with modest (or no) debt, trading on a P/E below 20.
We aim to bring you long-term focused research analysis driven by fundamental data. Note that our analysis may not factor in the latest price-sensitive company announcements or qualitative material.
If you spot an error that warrants correction, please contact the editor at editorial-team@simplywallst.com. This article by Simply Wall St is general in nature. It does not constitute a recommendation to buy or sell any stock, and does not take account of your objectives, or your financial situation. Simply Wall St has no position in the stocks mentioned. Thank you for reading.
